





Australian Dollar (AUD/USD) Techs: Aussie Bulls Tempt a Larger Turn
The past two monthly bars in AUD/USD have been indecisive but more recently, as USD-strength has come back to life, the Aussie has held its own quite well.
Share this:

AUD/USD Talking Points:
- AUD/USD has shown indecision on the past two monthly bars, which isn’t a very common occurrence on the longer time frame.
- Proximity to key swing lows makes that scenario of interest for possible topside swing setups.
- More recently, AUD/USD has held up relatively well as USD-strength has come rushing back. In the video and article below, I look at shorter-term support structure that, if respected, could allow for bullish swing setups.
AUD/USD was hit hard in the 4th quarter of last year, as USD-strength came back online in a big way. The pair was plummeting into the yearly open, but so far in 2025, bears haven’t had much room to run and from the monthly chart, there’s been a clear show of indecision.
I think the .6000 handle still looms large here as there’s been very few historical tests below that big figure. There was the instance around Covid, of course, and in that case, the pair held up just ten pips above the next major psychological level down of .5500. The .6000 test didn’t last for long, either, as the pair quickly snapped above and ran all the way until prices finally found resistance at the .7750 level.
That price was in-play for seven months – and bulls were unable to evoke a single monthly close above that level. And that failure eventually led into a bearish swing as prices slalomed on the way down towards that .6000 level again. But, this time, sellers suddenly got shy as the price got near, and in October of 2022, a low was set at .6170, a price that remains relevant today.
AUD/USD Monthly Price Chart
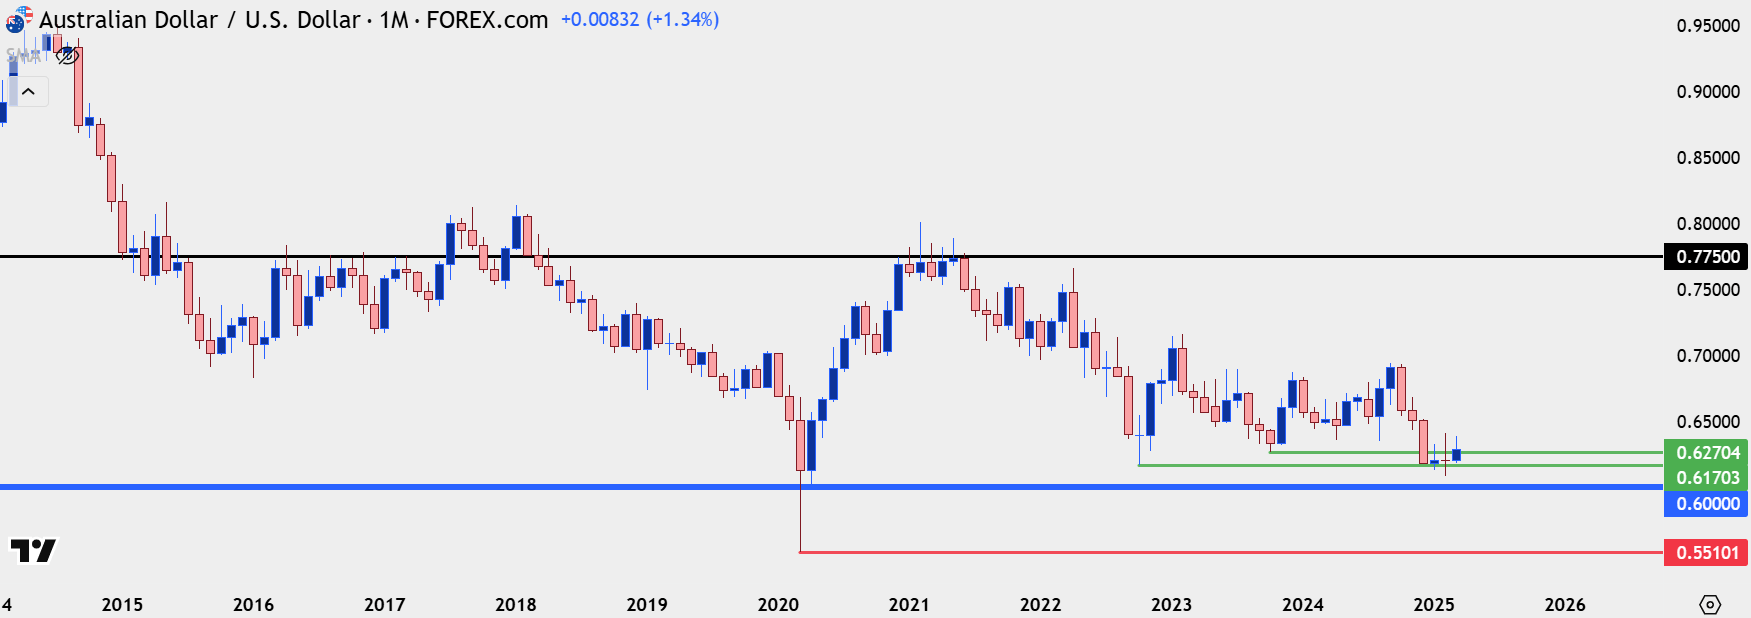 Chart prepared by James Stanley; data derived from Tradingview
AUD/USD Weekly
The bounce from .6170 was able to once again test above the .7000 handle, but not for very long. There was a single monthly (and weekly) close above that price after the bounce, and that was in January of 2023, after which sellers attacked. The bearish engulf that pushed prices back-below led into a prolonged sell-off, which led to the 2023 low 100 pips above the prior year’s low, once again in October of that year.
The pair had held up fairly well after that, at least until the Q4 open last year. And as that larger round of USD-reversals began to show AUD/USD was not left unscathed, with another bearish engulfing candlestick on the weekly chart leading to a prolonged sell-off, that pushed all the way into the open of the New Year.
AUD/USD Weekly Chart
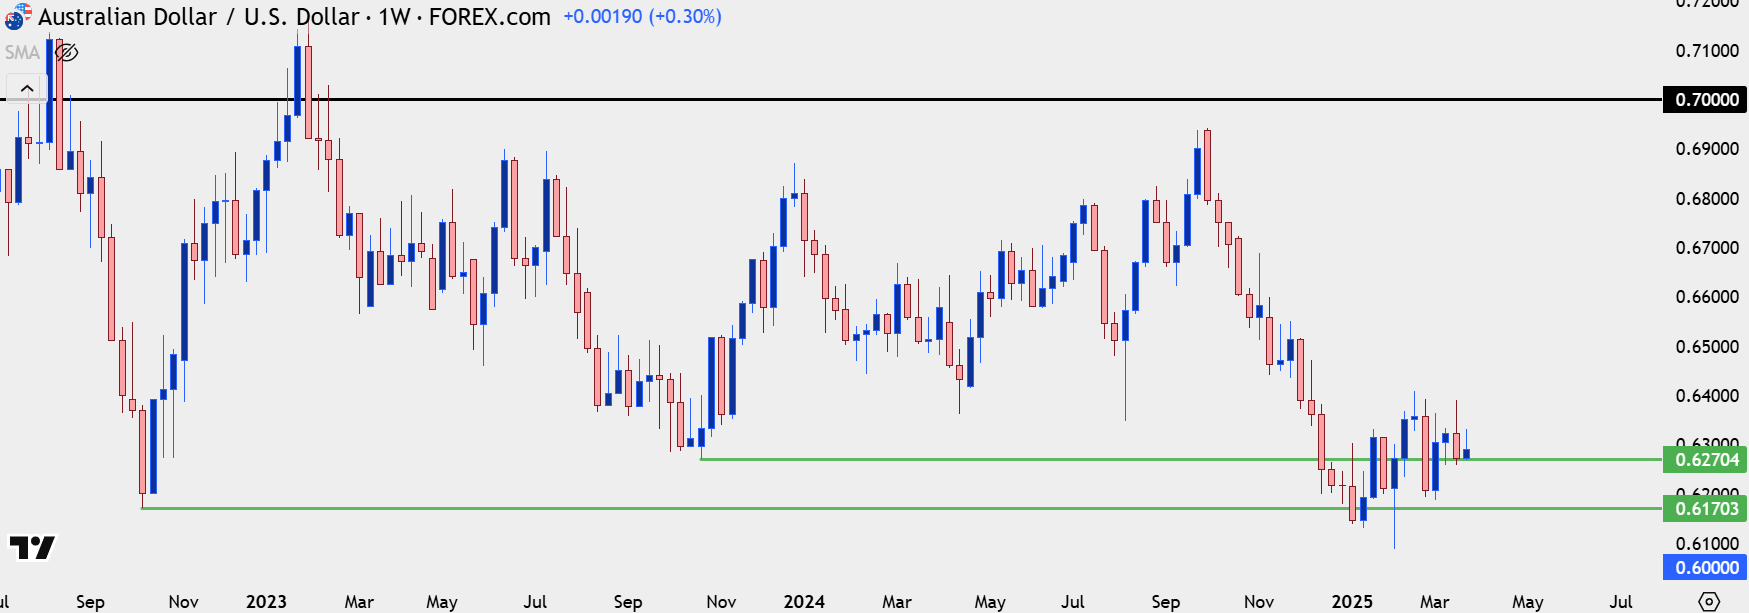 Chart prepared by James Stanley; data derived from Tradingview
AUD/USD
Those prices from the 2022 and 2023 swing lows retain some relevance today.
There was a single daily close below the 2022 low of .6170 after the 2025 open, and that led to a fast push up to a higher-high. The pullback from that again showed an element of support at .6170, with .6270 coming in as support after.
To date, bulls haven’t exactly been able to substantiate much run in the pair – but there has been the slowing of bearish pressure as sellers have shied away with those longer-term supports in the picture. And that’s the type of that that can eventually lead to a bullish reversal.
More recently, .6270 has helped to set the low so far this week; and from that, we can begin to set up a shorter-term backdrop that may allow for some strategy implementation.
AUD/USD Daily Chart
 Chart prepared by James Stanley; data derived from Tradingview
AUD/USD Shorter-Term Strategy
At this point the situation is pretty clear, where sellers have started to stall but bulls haven’t exactly been able to take over yet. From a shorter-term basis, however, there may be an opening door for a larger reversal, especially if we see USD-weakness come back into the picture.
So far this week the USD has continued to show higher-highs and lows, and that’s impacted EUR/USD and GBP/USD: But, notably, AUD/USD has also been putting in higher-highs and lows. And from the four-hour chart we can see some recent support structure that could allow for bullish swing setups, drawing on that .6270 longer-term level to help with setting support.
That .6270 level was clearly in the picture earlier in March on two separate occasions. More recently, the Friday swing low last week held with respect to .6258, and that’s the level that bulls need to hold above to retain control. Ideally, support swings will remain above .6270 and even better, above the .6278 swing low from last night.
AUD/USD Four-Hour Chart
 Chart prepared by James Stanley; data derived from Tradingview
--- written by James Stanley, Senior Strategist
AUD/USD Talking Points:
- AUD/USD has shown indecision on the past two monthly bars, which isn’t a very common occurrence on the longer time frame.
- Proximity to key swing lows makes that scenario of interest for possible topside swing setups.
- More recently, AUD/USD has held up relatively well as USD-strength has come rushing back. In the video and article below, I look at shorter-term support structure that, if respected, could allow for bullish swing setups.
AUD/USD was hit hard in the 4th quarter of last year, as USD-strength came back online in a big way. The pair was plummeting into the yearly open, but so far in 2025, bears haven’t had much room to run and from the monthly chart, there’s been a clear show of indecision.
I think the .6000 handle still looms large here as there’s been very few historical tests below that big figure. There was the instance around Covid, of course, and in that case, the pair held up just ten pips above the next major psychological level down of .5500. The .6000 test didn’t last for long, either, as the pair quickly snapped above and ran all the way until prices finally found resistance at the .7750 level.
That price was in-play for seven months – and bulls were unable to evoke a single monthly close above that level. And that failure eventually led into a bearish swing as prices slalomed on the way down towards that .6000 level again. But, this time, sellers suddenly got shy as the price got near, and in October of 2022, a low was set at .6170, a price that remains relevant today.
AUD/USD Monthly Price Chart
AUD/USD Weekly
The bounce from .6170 was able to once again test above the .7000 handle, but not for very long. There was a single monthly (and weekly) close above that price after the bounce, and that was in January of 2023, after which sellers attacked. The bearish engulf that pushed prices back-below led into a prolonged sell-off, which led to the 2023 low 100 pips above the prior year’s low, once again in October of that year.
The pair had held up fairly well after that, at least until the Q4 open last year. And as that larger round of USD-reversals began to show AUD/USD was not left unscathed, with another bearish engulfing candlestick on the weekly chart leading to a prolonged sell-off, that pushed all the way into the open of the New Year.
AUD/USD Weekly Chart
AUD/USD
Those prices from the 2022 and 2023 swing lows retain some relevance today.
There was a single daily close below the 2022 low of .6170 after the 2025 open, and that led to a fast push up to a higher-high. The pullback from that again showed an element of support at .6170, with .6270 coming in as support after.
To date, bulls haven’t exactly been able to substantiate much run in the pair – but there has been the slowing of bearish pressure as sellers have shied away with those longer-term supports in the picture. And that’s the type of that that can eventually lead to a bullish reversal.
More recently, .6270 has helped to set the low so far this week; and from that, we can begin to set up a shorter-term backdrop that may allow for some strategy implementation.
AUD/USD Daily Chart
AUD/USD Shorter-Term Strategy
At this point the situation is pretty clear, where sellers have started to stall but bulls haven’t exactly been able to take over yet. From a shorter-term basis, however, there may be an opening door for a larger reversal, especially if we see USD-weakness come back into the picture.
So far this week the USD has continued to show higher-highs and lows, and that’s impacted EUR/USD and GBP/USD: But, notably, AUD/USD has also been putting in higher-highs and lows. And from the four-hour chart we can see some recent support structure that could allow for bullish swing setups, drawing on that .6270 longer-term level to help with setting support.
That .6270 level was clearly in the picture earlier in March on two separate occasions. More recently, the Friday swing low last week held with respect to .6258, and that’s the level that bulls need to hold above to retain control. Ideally, support swings will remain above .6270 and even better, above the .6278 swing low from last night.
AUD/USD Four-Hour Chart
--- written by James Stanley, Senior Strategist
Related tags:



Open an account in minutes
Experience award-winning platforms with fast and secure execution, and enjoy tight spreads from 0.5 pts on FX and 0.3 pts on indices.
Economic calendar
Web Trader platform
Our sophisticated web-based platform is packed with features.
Related articles

Gold Does Something it Hasn’t Done in a Year, is Larger Risk-Off Afoot?
With tech stocks getting hit harder last week there was collateral damage elsewhere, including gold as the metal closed below the $4k level for the week and that’s the first time that’s happened to spot gold in more than a year.

US Dollar Price Action Setups: EUR/USD, USD/JPY, GBP/USD, USD/CAD
The Dollar is working on its second consecutive red week and while sellers didn’t exactly pounce on fresh lows, there’s an opening door for bears to make a move.

Australian Dollar Forecast: AUD/USD Support Reversal Sparks Monthly Range Breakout 10 23 2026
A sharp reversal off key support has fueled the AUD/USD recovery, with resistance now in focus ahead of next week’s Fed decision and Australian CPI.
This report is intended for general circulation only. It should not be construed as a recommendation, or an offer (or solicitation of an offer) to buy or sell any financial products. The information provided does not take into account your specific investment objectives, financial situation or particular needs. Before you act on any recommendation that may be contained in this report, independent advice ought to be sought from a financial adviser regarding the suitability of the investment product, taking into account your specific investment objectives, financial situation or particular needs.
StoneX Financial Pte. Ltd., may distribute reports produced by its respective foreign entities or affiliates within the StoneX group of companies or third parties pursuant to an arrangement under Regulation 32C of the Financial Advisers Regulations. Where the report is distributed to a person in Singapore who is not an accredited investor, expert investor or an institutional investor (as defined in the Securities Futures Act), StoneX Financial Pte. Ltd. accepts legal responsibility to such persons for the contents of the report only to the extent required by law. Singapore recipients should contact StoneX Financial Pte. Ltd. at 6826 9988 for matters arising from, or in connection with the report.
In the case of all other recipients of this report, to the extent permitted by applicable laws and regulations neither StoneX Financial Pte. Ltd. nor its associated companies will be responsible or liable for any loss or damage incurred arising out of, or in connection with, any use of the information contained in this report and all such liability is hereby expressly disclaimed. No representation or warranty is made, express or implied, that the content of this report is complete or accurate.
StoneX Financial Pte. Ltd. is not under any obligation to update this report.
Trading CFDs carries a high level of risk that may not be suitable for some investors. Consider your investment objectives, level of experience, financial resources, risk appetite and other relevant circumstances carefully. The possibility exists that you could lose some or all of your investments, including your initial deposits. If in doubt, please seek independent expert advice. Visit www.forex.com/en-sg/terms-and-policies for the complete Risk Disclosure Statement.