



British Pound Technical Analysis: GBP/USD, GBP/JPY
GBP/USD has rallied up to a fresh four-month high and remains one of the more attractive major pairs for USD-weakness, although a rush of Yen-strength has brought question to GBP/JPY.
Share this:


The commotion has certainly been in other markets like USD/JPY of late but in GBP/USD, the pair has continued a consistent rally after building a clean falling wedge formation just two weeks ago. I looked at this as one of the more attractive venues for USD-weakness and as the Dollar has broken down, that bullish structure in GBP/USD has played out.
Last week even saw a clean hold of support at the 1.3414 Fibonacci level, leading to a rally up to a fresh high in a breakout that continues into this week.
GBP/USD Four-Hour Price Chart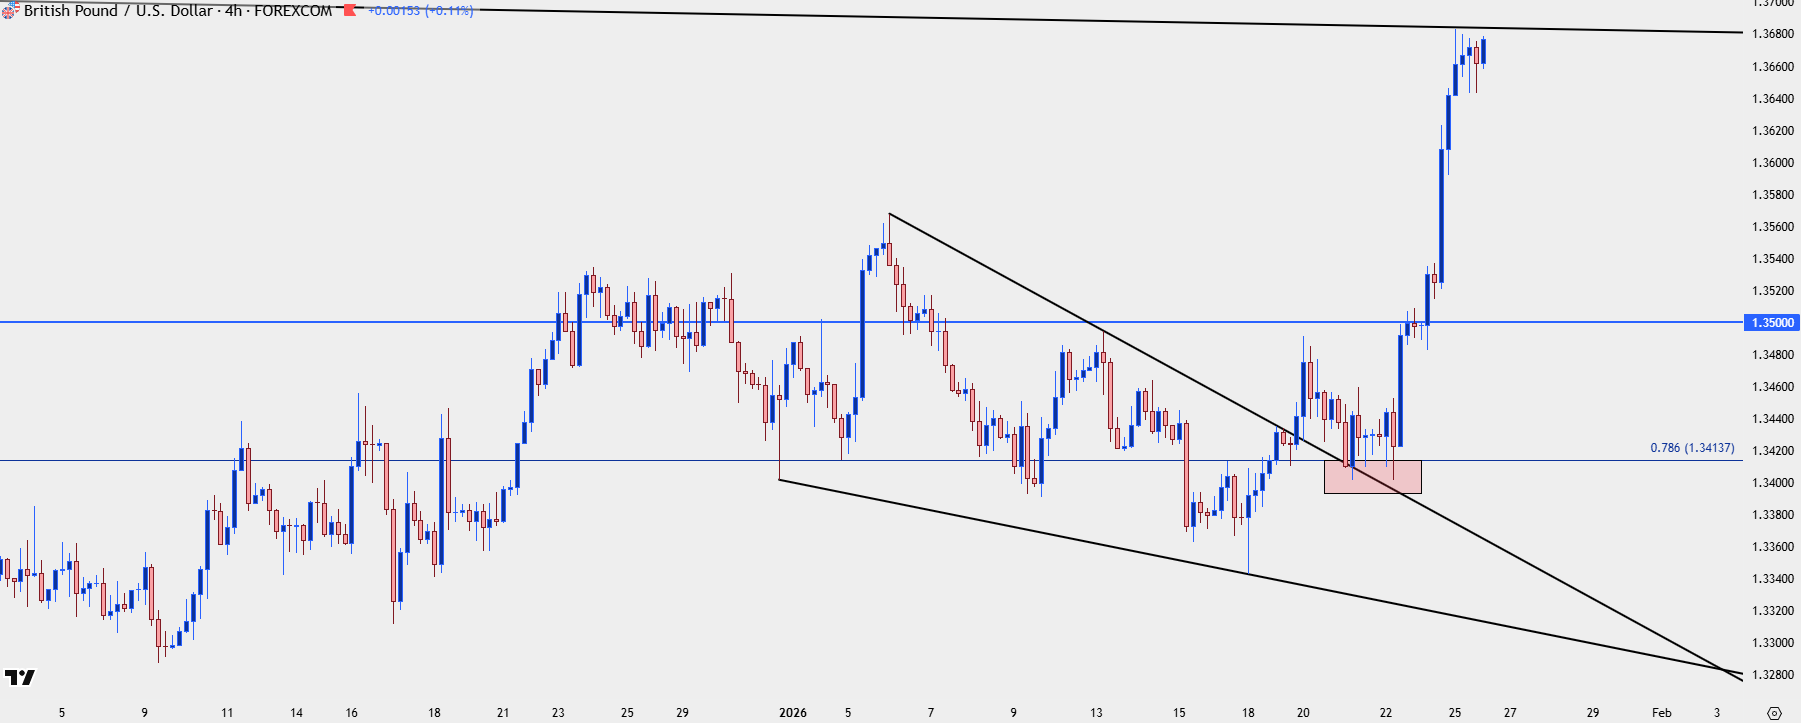
Chart prepared by James Stanley; data derived from Tradingview
GBP/USD: The Road Ahead
At this point it seems like a lot of the drive in the major pair is coming from dynamics in the US Dollar. Just two weeks ago, the USD was holding strong near monthly highs. But the weekend brought more tariff threats from President Trump and that reversed the currency last week, which helped Cable to breakout from the falling wedge formation. And then the late week USD/JPY sell-off drove another round of USD-weakness against both GBP and the Euro and that further helped to drive the rally.
At this point, both GBP/USD and DXY are in a stretched state so the bigger question probably drives back to the Yen and whether there’s more carry unwind left to be seen. For GBP/USD, there’s two significant points of resistance sitting overhead at 1.3727 and 1.3789 as these lower-highs posted in the second-half of last year. If bulls can take both out, we’ll be at fresh four-year highs and there will be an open door to run up to the 1.4000 level, or perhaps even the 1.4250 level that marked the highs back in 2021.
GBP/USD Weekly Price Chart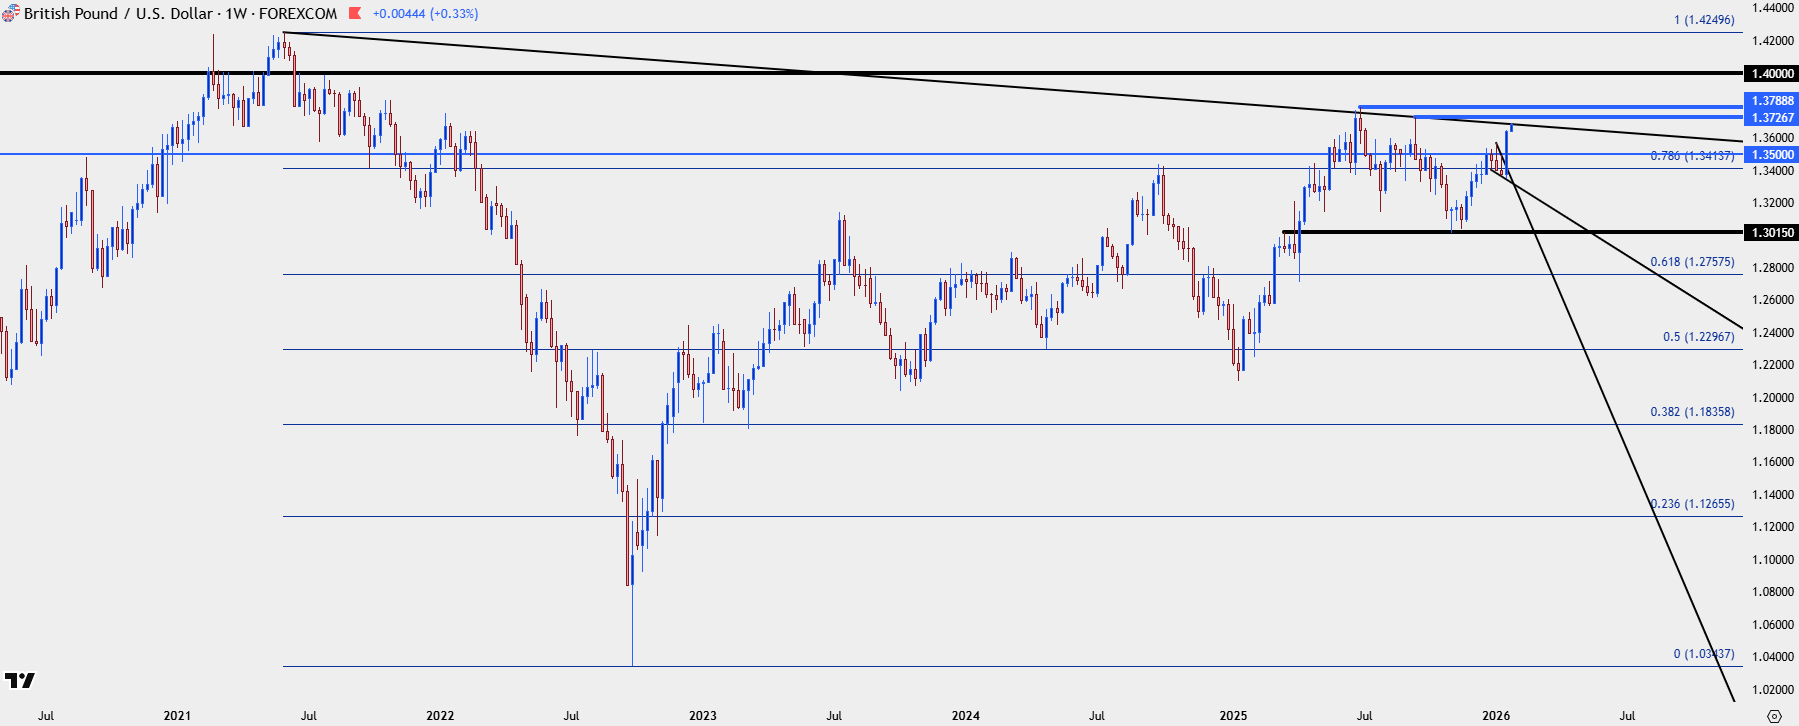
Chart prepared by James Stanley; data derived from Tradingview
GBP/JPY
While GBP/USD has remained in a clean trend JPY pairs have been showing heightened volatility, especially in USD/JPY with the fear or thought that perhaps even more unwind may be seen after highly suspected intervention.
This is a messy scenario usually as it takes time to confirm whether actual intervention took place and at this stage it’s still impossible to tell whether it was fear driving carry unwind into last week’s close and through last week’s open or whether there was, in fact, some form of swap-line arrangement between Japan and the U.S.
Like I talked about in last week’s webinar it seems that both sides wanted to see a lower USD/JPY spot rate and that’s something that can explain at least part of the move. But perhaps the more important question is whether that shot of Yen-strength has run its course or whether there’s more unwind to go.
On the unwind argument, JPY-weakness trades had become incredibly one-sided since Japanese elections in early October, and that had helped to drive-up Japanese Yen government bond yields, which would seemingly make it more difficult for the Japanese government to continue driving fiscal stimulus, as more debt would become more and more expensive. And in the Friday BoJ meeting, the bank highlighted the prospect of more rate hikes which sent an initial shockwave into Yen markets.
If you’re a hedge fund holding hedges from an ongoing carry trade and you’re factoring in higher rates from the BoJ and, eventually, lower rates from the Fed, and price in the USD/JPY pair just stalled again at the 160.00 level that’s highly thought to elicit intervention, closing down to those trades doesn’t seem to be the worst idea in the world. The question now is whether bulls get back on the long side of Yen-pairs and that’s something we have to wait and evaluate this week.
In GBP/JPY, the pair is back down to range support, re-testing the 210.00 level, the same that was in-play in late-December. Prior range resistance at 211.42-211.59 is the next spot of resistance on the chart, followed by 212.60.
This seems to be a derivative factor of the larger Yen carry unwind episode that’s a battleground in USD/JPY, at the moment, but if we do see Yen-weakness coming back, this is an attractive backdrop, perhaps even more so than the major pair.
GBP/JPY Four-Hour Price Chart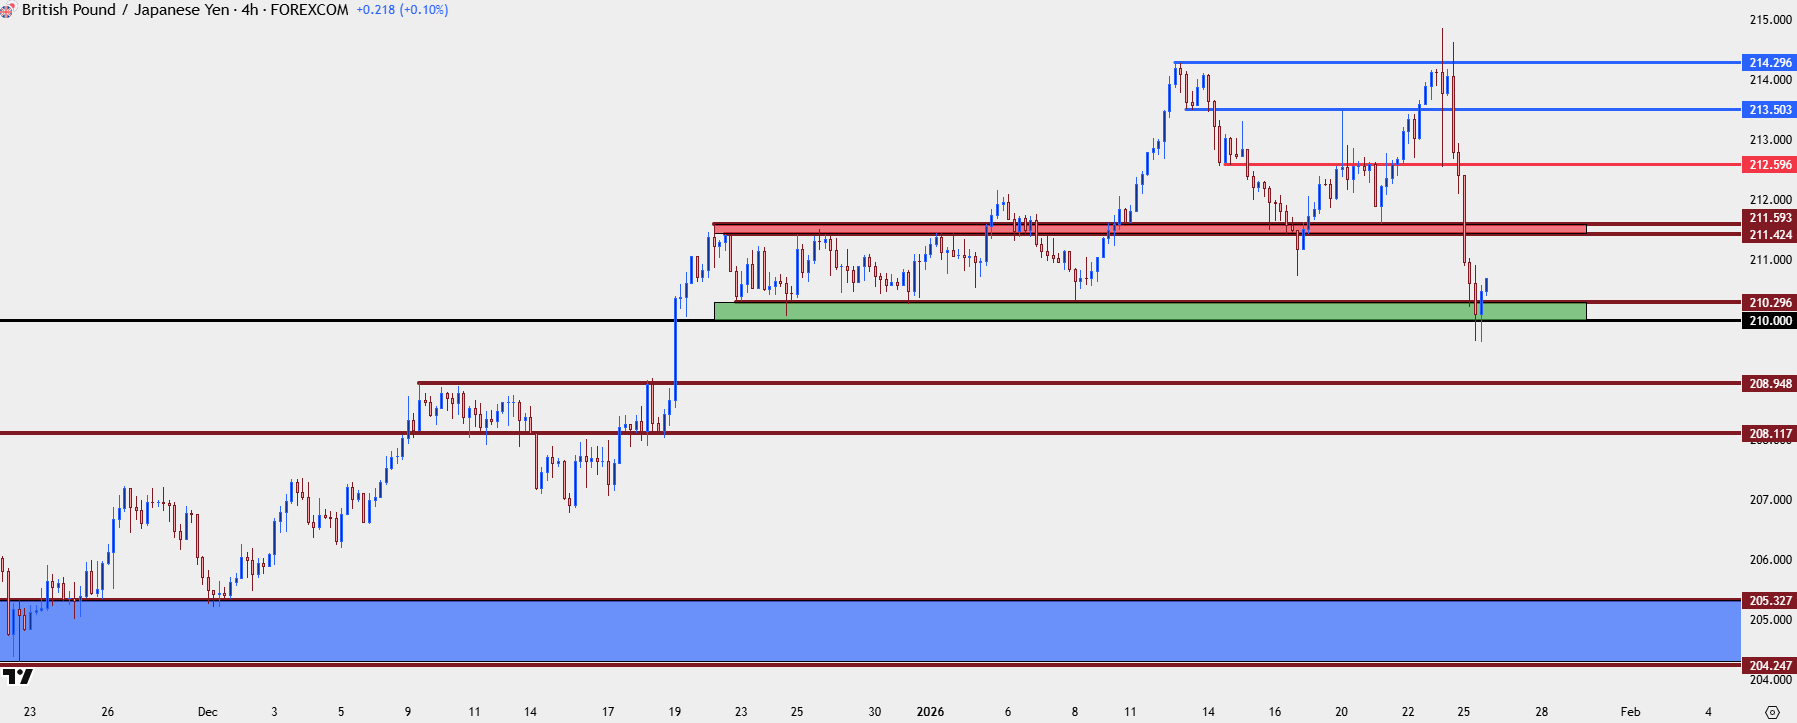
Chart prepared by James Stanley; data derived from Tradingview
--- written by James Stanley, Senior Market Analyst, Global Macro
Related tags:



Open an account in minutes
Experience award-winning platforms with fast and secure execution, and enjoy tight spreads from 0.5 pts on FX and 0.3 pts on indices.
Economic calendar
Web Trader platform
Our sophisticated web-based platform is packed with features.
Related articles

USD Sets Fresh Yearly High as EUR/USD Drops Dramatically, USD/JPY Stable
Well, it was a week of USD strength that wasn’t entirely pushed by USD/JPY, as a strong sell-off in EUR/USD has pushed the major pair to its most oversold state in a decade.

EUR/USD, GBP/USD Outlook: RSI Hits 2020 Oversold Levels
EUR/USD, GBP/USD Outlook: The EUR/USD daily RSI has fallen to oversold levels last seen in 2020, raising the risk of a reversal across correlated currency pairs, including the US dollar and GBP/USD.


Gold Price Outlook: XAU/USD Resistance at $4200 Sets Up for NFP
It was a strong sell-off to start the week in gold and despite a Tuesday bounce, sellers are continuing to push following a resistance hit at the $4200 level.
This report is intended for general circulation only. It should not be construed as a recommendation, or an offer (or solicitation of an offer) to buy or sell any financial products. The information provided does not take into account your specific investment objectives, financial situation or particular needs. Before you act on any recommendation that may be contained in this report, independent advice ought to be sought from a financial adviser regarding the suitability of the investment product, taking into account your specific investment objectives, financial situation or particular needs.
StoneX Financial Pte. Ltd., may distribute reports produced by its respective foreign entities or affiliates within the StoneX group of companies or third parties pursuant to an arrangement under Regulation 32C of the Financial Advisers Regulations. Where the report is distributed to a person in Singapore who is not an accredited investor, expert investor or an institutional investor (as defined in the Securities Futures Act), StoneX Financial Pte. Ltd. accepts legal responsibility to such persons for the contents of the report only to the extent required by law. Singapore recipients should contact StoneX Financial Pte. Ltd. at 6826 9988 for matters arising from, or in connection with the report.
In the case of all other recipients of this report, to the extent permitted by applicable laws and regulations neither StoneX Financial Pte. Ltd. nor its associated companies will be responsible or liable for any loss or damage incurred arising out of, or in connection with, any use of the information contained in this report and all such liability is hereby expressly disclaimed. No representation or warranty is made, express or implied, that the content of this report is complete or accurate.
StoneX Financial Pte. Ltd. is not under any obligation to update this report.
Trading CFDs carries a high level of risk that may not be suitable for some investors. Consider your investment objectives, level of experience, financial resources, risk appetite and other relevant circumstances carefully. The possibility exists that you could lose some or all of your investments, including your initial deposits. If in doubt, please seek independent expert advice. Visit www.forex.com/en-sg/terms-and-policies for the complete Risk Disclosure Statement.