




Canadian Dollar Forecast: USD/CAD Sells-Off on Trump Tariff Chaos
USD/CAD was rejected at 1.4500 this week and now that there’s another potential delay in U.S. and Canada tariffs, USD/CAD is primed for larger pullback potential.
Share this:

USD/CAD, Canadian Dollar Talking Points:
- Canada and USD/CAD have been a primary focal point in the tariff strategy from President Donald Trump, and this has pushed USD/CAD aggressively since the election in November.
- On a longer-term basis, USD/CAD retains a range, and prices this week have so far held resistance at the 1.4500 handle which could constitute a lower-high in that big picture look.
It’s been a brutal week for the U.S. Dollar, but that move of USD-weakness wasn’t as clear in USD/CAD until this morning, as a potential thawing in the U.S.-Canada trade war has started to show. This remains a fluid situation so it can certainly change, but at this point it appears that there will be another delay in tariff implementation. As reported by Bloomberg, U.S. Commerce Secretary Howard Lutnick has said that President Trump is likely to defer tariffs on Canada and Mexico for all goods and services covered by the North American trade agreement known as USMCA.
This has helped to drive both USD-weakness and CAD-strength into the pair, further reinforcing the longer-term range continuation scenario that I’ve been highlighting in these pieces. The 1.4371 level that was support previously came in as resistance, and bears have been going to work since the U.S. opened for the day.
USD/CAD 30-Minute Chart
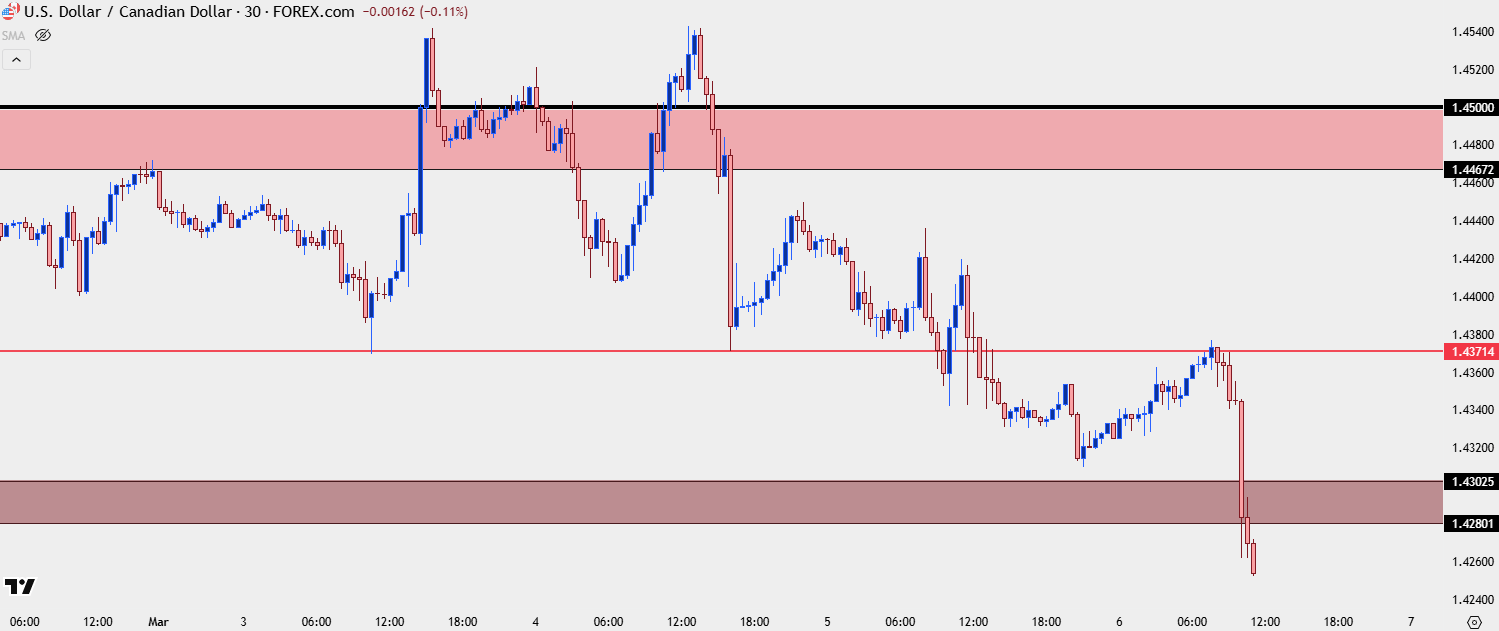 Chart prepared by James Stanley; data derived from Tradingview
But this isn’t the first twist or turn that we’ve seen in this saga, and it’s unlikely to be the last, particularly if this is being framed as more of a delay in tariff implementation. So, rather than take a bottom up look at the situation, I want to approach this in a top-down scenario by using charts and bigger picture themes in the USD/CAD pair.
USD/CAD Monthly Chart
I was highlighting this back in November and December as the tariff theme was starting to take off. At the time, USD/CAD was starting to gain acceptance over the 1.4000 level, which hadn’t been in the picture for the prior four years. Initially Trump’s comments seemed to be in jest, calling Canada a 51st state and Trudeau a ‘governor’ as opposed to Prime Minister. But Trump’s focus seemed to be more on border security than economic parity, as he commented multiple times about the flow of drugs and migrants across U.S. borders.
This came back into the picture in February. Initially tariffs were supposed to come into play on ‘Day One,’ of his administration, which was then pushed back to February 1st, which fell on a Saturday. On the Friday before, there was a mass of confusion as an earlier report of a delay until March 1st was refuted by the White House, leading to a strong bid in USD/CAD as markets prepared for the possibility of the unknown; because at that point we had no clue what tariffs might look like.
I warned of pandemonium on the open for the next week and that’s precisely what played out, with the USD/CAD pair jumping up to a fresh 21-year high before ultimately pulling back. And then when a delay was announced shortly after the U.S. open on that Monday, USD/CAD reversed more aggressively, leaving a large bearish engulfing pattern on the weekly chart.
For the first half of February, USD/CAD retained a bearish look; but it was around mid-month as the next deadline approached that the pair perked back up, making another run at the 1.4500 level. The monthly close for February was very near the open, making for an indecisive monthly candle that can be argued as either a doji or a spinning top. But, taken with the prior range, there remains mean-reversion potential in the pair.
USD/CAD Monthly Chart
 Chart prepared by James Stanley; data derived from Tradingview
USD/CAD Weekly
This week was the next deadline in the US-Canada trade war theme, and there remains considerable confusion. That hasn’t been the only factor hitting U.S. markets, as there’s also been the onset of recession fears which has helped to push a very weak outlay for the U.S. Dollar.
But it’s the 1.4500 level that’s been on display so far this week for USD/CAD as it’s held the highs and retained the potential for longer-term range continuation in the pair.
USD/CAD Weekly Chart
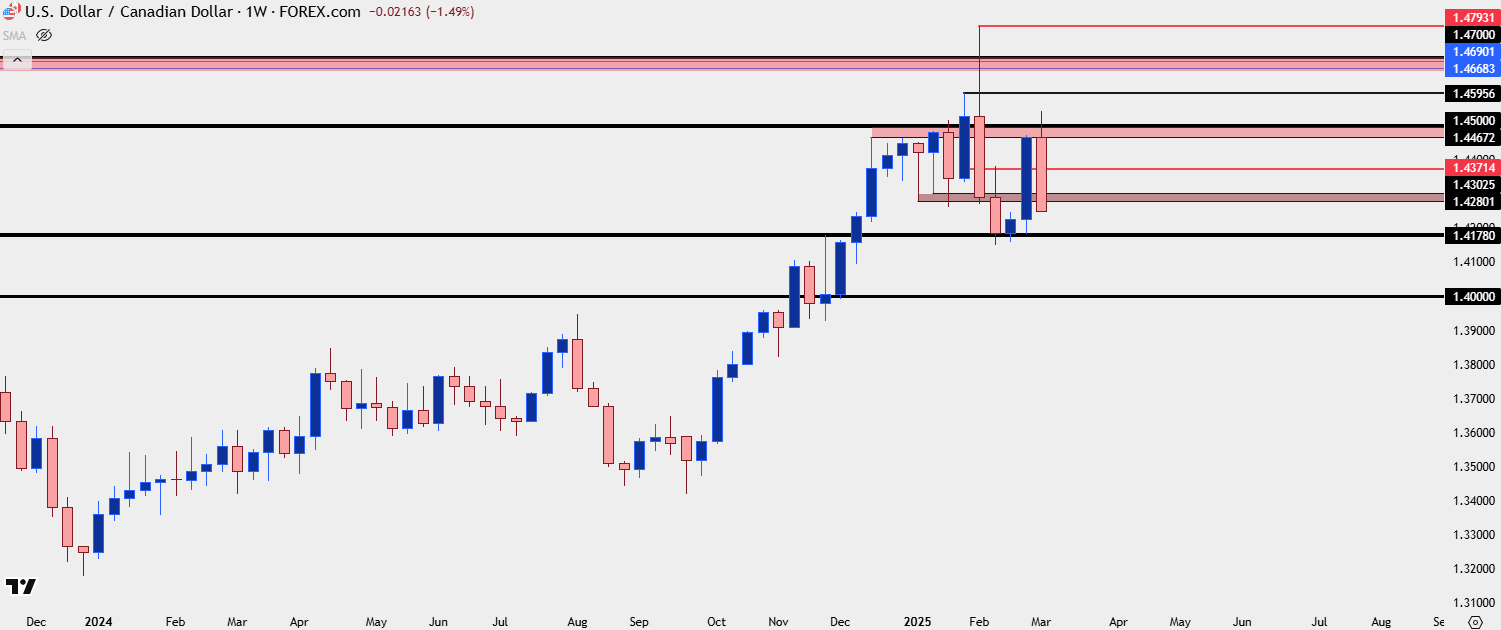 Chart prepared by James Stanley; data derived from Tradingview
USD/CAD Shorter-Term
In this weekend’s article, USD/CAD retained bullish potential as that next deadline was approaching. The 1.4371 prior swing was of interest for support, and on both Monday and Tuesday, that’s what helped to hold the lows. But the Wednesday sell-off in USD/CAD has taken that level out and now that there’s hope for another delay into April, there’s a continued pullback showing in the pair and price has already taken-out the 1.4300 level. This puts the focus for next support on the prior swing of 1.4178, and if sellers can chew through that, the critical 1.4000 level is in view.
The big question here is whether Trump or the U.S. wants a prolonged trade war, and given the impact that’s already shown to economic expectations, rate cut expectations, stocks and the U.S. Dollar, it would appear that the motivation for such a scenario is continuing to diminish. Again – this can change and it remains as a fluid situation, but that’s why longer-term charts matter as I’ve been pointing out that bigger picture range in USD/CAD for the past few months.
USD/CAD Daily Chart
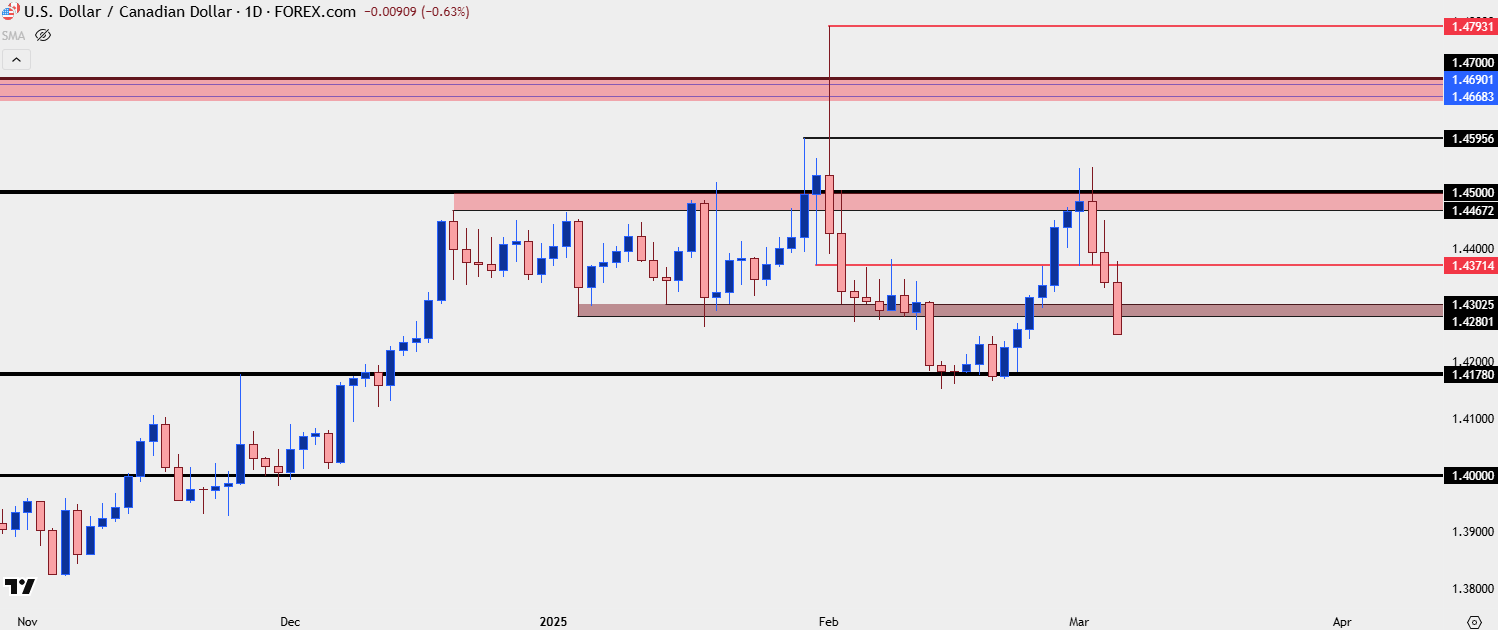 Chart prepared by James Stanley; data derived from Tradingview
--- written by James Stanley, Senior Strategist
USD/CAD, Canadian Dollar Talking Points:
- Canada and USD/CAD have been a primary focal point in the tariff strategy from President Donald Trump, and this has pushed USD/CAD aggressively since the election in November.
- On a longer-term basis, USD/CAD retains a range, and prices this week have so far held resistance at the 1.4500 handle which could constitute a lower-high in that big picture look.
It’s been a brutal week for the U.S. Dollar, but that move of USD-weakness wasn’t as clear in USD/CAD until this morning, as a potential thawing in the U.S.-Canada trade war has started to show. This remains a fluid situation so it can certainly change, but at this point it appears that there will be another delay in tariff implementation. As reported by Bloomberg, U.S. Commerce Secretary Howard Lutnick has said that President Trump is likely to defer tariffs on Canada and Mexico for all goods and services covered by the North American trade agreement known as USMCA.
This has helped to drive both USD-weakness and CAD-strength into the pair, further reinforcing the longer-term range continuation scenario that I’ve been highlighting in these pieces. The 1.4371 level that was support previously came in as resistance, and bears have been going to work since the U.S. opened for the day.
USD/CAD 30-Minute Chart
Chart prepared by James Stanley; data derived from Tradingview
But this isn’t the first twist or turn that we’ve seen in this saga, and it’s unlikely to be the last, particularly if this is being framed as more of a delay in tariff implementation. So, rather than take a bottom up look at the situation, I want to approach this in a top-down scenario by using charts and bigger picture themes in the USD/CAD pair.
USD/CAD Monthly Chart
I was highlighting this back in November and December as the tariff theme was starting to take off. At the time, USD/CAD was starting to gain acceptance over the 1.4000 level, which hadn’t been in the picture for the prior four years. Initially Trump’s comments seemed to be in jest, calling Canada a 51st state and Trudeau a ‘governor’ as opposed to Prime Minister. But Trump’s focus seemed to be more on border security than economic parity, as he commented multiple times about the flow of drugs and migrants across U.S. borders.
This came back into the picture in February. Initially tariffs were supposed to come into play on ‘Day One,’ of his administration, which was then pushed back to February 1st, which fell on a Saturday. On the Friday before, there was a mass of confusion as an earlier report of a delay until March 1st was refuted by the White House, leading to a strong bid in USD/CAD as markets prepared for the possibility of the unknown; because at that point we had no clue what tariffs might look like.
I warned of pandemonium on the open for the next week and that’s precisely what played out, with the USD/CAD pair jumping up to a fresh 21-year high before ultimately pulling back. And then when a delay was announced shortly after the U.S. open on that Monday, USD/CAD reversed more aggressively, leaving a large bearish engulfing pattern on the weekly chart.
For the first half of February, USD/CAD retained a bearish look; but it was around mid-month as the next deadline approached that the pair perked back up, making another run at the 1.4500 level. The monthly close for February was very near the open, making for an indecisive monthly candle that can be argued as either a doji or a spinning top. But, taken with the prior range, there remains mean-reversion potential in the pair.
USD/CAD Monthly Chart
Chart prepared by James Stanley; data derived from Tradingview
USD/CAD Weekly
This week was the next deadline in the US-Canada trade war theme, and there remains considerable confusion. That hasn’t been the only factor hitting U.S. markets, as there’s also been the onset of recession fears which has helped to push a very weak outlay for the U.S. Dollar.
But it’s the 1.4500 level that’s been on display so far this week for USD/CAD as it’s held the highs and retained the potential for longer-term range continuation in the pair.
USD/CAD Weekly Chart
Chart prepared by James Stanley; data derived from Tradingview
USD/CAD Shorter-Term
In this weekend’s article, USD/CAD retained bullish potential as that next deadline was approaching. The 1.4371 prior swing was of interest for support, and on both Monday and Tuesday, that’s what helped to hold the lows. But the Wednesday sell-off in USD/CAD has taken that level out and now that there’s hope for another delay into April, there’s a continued pullback showing in the pair and price has already taken-out the 1.4300 level. This puts the focus for next support on the prior swing of 1.4178, and if sellers can chew through that, the critical 1.4000 level is in view.
The big question here is whether Trump or the U.S. wants a prolonged trade war, and given the impact that’s already shown to economic expectations, rate cut expectations, stocks and the U.S. Dollar, it would appear that the motivation for such a scenario is continuing to diminish. Again – this can change and it remains as a fluid situation, but that’s why longer-term charts matter as I’ve been pointing out that bigger picture range in USD/CAD for the past few months.
USD/CAD Daily Chart
Chart prepared by James Stanley; data derived from Tradingview
--- written by James Stanley, Senior Strategist
Related tags:


Open an account in minutes
Experience award-winning platforms with fast and secure execution, and enjoy tight spreads from 0.5 pts on FX and 0.3 pts on indices.
Economic calendar
Web Trader platform
Our sophisticated web-based platform is packed with features.
Related articles
Gold Breaks Down on Descending Triangle, Sets Up $4k Test
Gold started last week with a strong sell-off but from that move a bounce developed. Bulls could not hold on through the weekly close, however, and the bearish structure remains in-place for XAU/USD.

USD/CAD forecast: rally could accelerate above June highs at 1.4250
USD/CAD recovered quickly after weaker US jobs data, keeping the bullish trend in focus. A move above the June highs could accelerate the rally as inflation keeps the Fed under pressure.


USD Sets Fresh Yearly High as EUR/USD Drops Dramatically, USD/JPY Stable
Well, it was a week of USD strength that wasn’t entirely pushed by USD/JPY, as a strong sell-off in EUR/USD has pushed the major pair to its most oversold state in a decade.
This report is intended for general circulation only. It should not be construed as a recommendation, or an offer (or solicitation of an offer) to buy or sell any financial products. The information provided does not take into account your specific investment objectives, financial situation or particular needs. Before you act on any recommendation that may be contained in this report, independent advice ought to be sought from a financial adviser regarding the suitability of the investment product, taking into account your specific investment objectives, financial situation or particular needs.
StoneX Financial Pte. Ltd., may distribute reports produced by its respective foreign entities or affiliates within the StoneX group of companies or third parties pursuant to an arrangement under Regulation 32C of the Financial Advisers Regulations. Where the report is distributed to a person in Singapore who is not an accredited investor, expert investor or an institutional investor (as defined in the Securities Futures Act), StoneX Financial Pte. Ltd. accepts legal responsibility to such persons for the contents of the report only to the extent required by law. Singapore recipients should contact StoneX Financial Pte. Ltd. at 6826 9988 for matters arising from, or in connection with the report.
In the case of all other recipients of this report, to the extent permitted by applicable laws and regulations neither StoneX Financial Pte. Ltd. nor its associated companies will be responsible or liable for any loss or damage incurred arising out of, or in connection with, any use of the information contained in this report and all such liability is hereby expressly disclaimed. No representation or warranty is made, express or implied, that the content of this report is complete or accurate.
StoneX Financial Pte. Ltd. is not under any obligation to update this report.
Trading CFDs carries a high level of risk that may not be suitable for some investors. Consider your investment objectives, level of experience, financial resources, risk appetite and other relevant circumstances carefully. The possibility exists that you could lose some or all of your investments, including your initial deposits. If in doubt, please seek independent expert advice. Visit www.forex.com/en-sg/terms-and-policies for the complete Risk Disclosure Statement.