



CBRT cuts rates despite soaring inflation, weak Lira
After last weeks surprise rate cut by the CBRT, USD/TRY moved to its highest level since December 20th, 2021.
Share this:

Last week, the Central Bank of the Republic of Turkey (CBRT) surprised markets by cutting interest rates 100bps to 13% from 14%, despite an increase in inflation during July of 79.6% YoY, the highest level since 1998! Expectations were for the CBRT to leave rates unchanged. This was the first time the central bank cut rates since December 2021, when it ended its string of consecutive rate cuts and lowered rates by a total of 500bps! The central bank noted that it sees inflation decreasing after the Russia/Ukraine war. Recall that Turkey’s President Erdogan had been instructing central bank governors to cut the main interest rate since inflation began rising after the pandemic. If they did not do as instructed, they were fired.
Over the weekend, the CBRT took steps to decrease the gap between its policy rate and lending rates. The central bank replaced an existing 20% RRR for credits with a higher 30% treasury bond collateral requirement (Reuters).
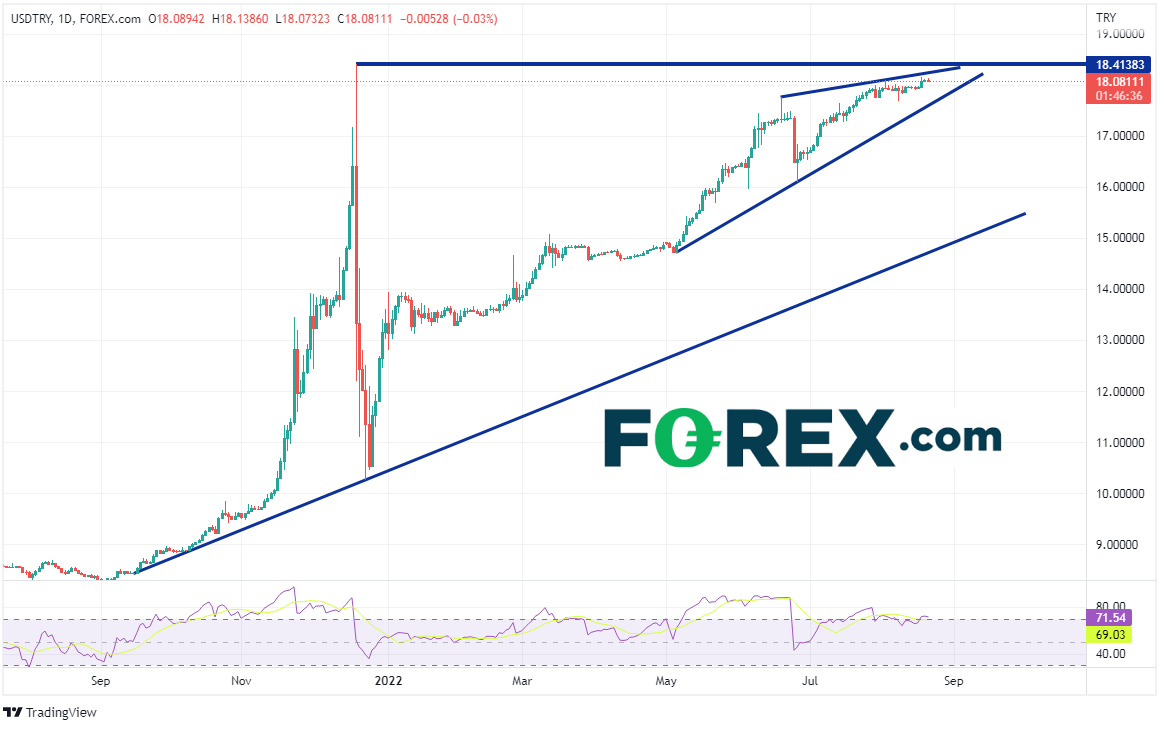
USD/TRY began trading aggressively higher in the fall of 2021 as inflation began moving rapidly back into the world economy. Price moved from a low 8.2640 on September 2nd, 2021 to a high of 18.4138 on December 20th, 2021. The pair then violently corrected over the next few days, retracing to 10.2491 by December 23rd. However, by mid-January of this year, USD/TRY leveled out near 13.15 before its slow price ascent during 2022. On Thursday, the date of the latest rate cut, the pair reached its highest level since December 20th at 18.1532.
Source: Tradingview, Stone X
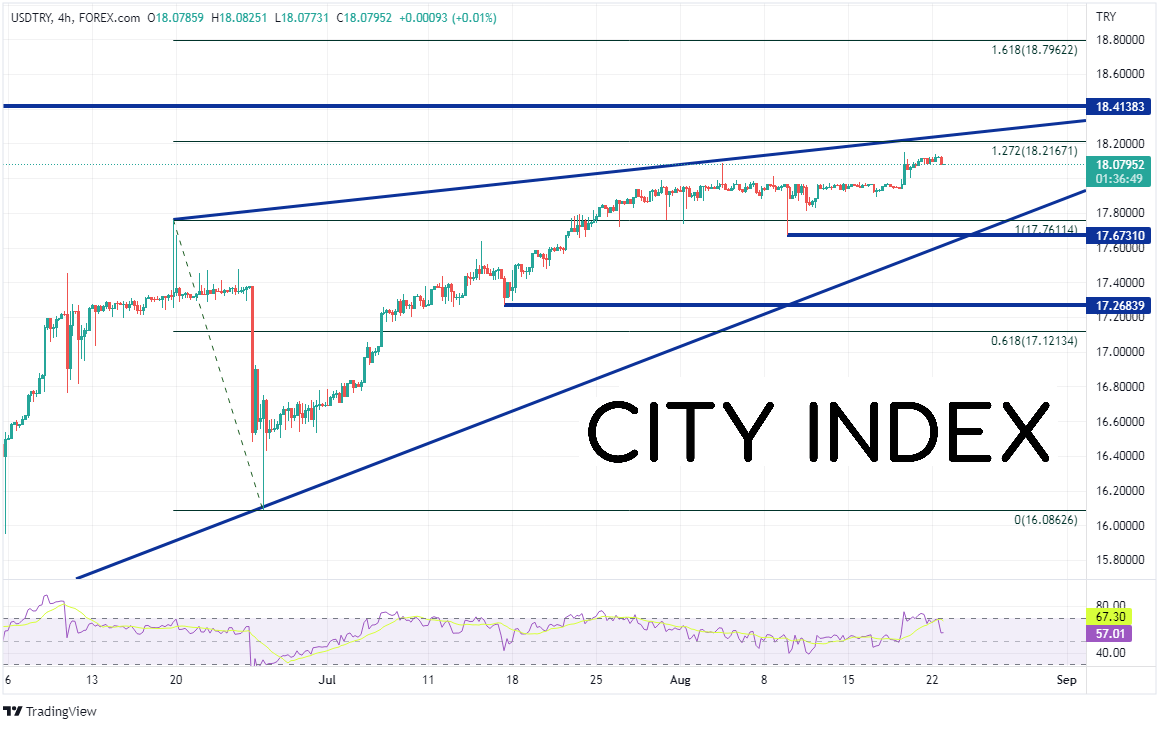
On a 240-minute timeframe, USD/TRY has been rising in an ascending wedge formation since late June. The expected breakout of an ascending wedge is lower. If price is to move lower, it must first break through the horizontal support at 17.6731. Below there, price can fall to the bottom, upward sloping trendline of the wedge bear 17.6000 and then additional horizontal support at 17.2684. However, if the pair continues higher, there is a confluence of resistance just above at the 127.2% Fibonacci extension level from the highs of June 19th to the lows of June 27th near 18.2167 and the top upward sloping trendline of the wedge near 18.2167. Above there, USD/TRY can move to the highs from December 2021 at 18.4138, then the 161.8% Fibonacci extension from the previously mentioned timeframe at 18.7962.

Source: Tradingview, Stone X
After last weeks surprise rate cut by the CBRT, USD/TRY moved to its highest level since December 20th, 2021. Could the pair take out the previous highs? With inflation continuing to increase and the central bank continuing to cut rates, it makes sense that the pair will continue higher. However, remember that the market doesn’t always act rational!
Last week, the Central Bank of the Republic of Turkey (CBRT) surprised markets by cutting interest rates 100bps to 13% from 14%, despite an increase in inflation during July of 79.6% YoY, the highest level since 1998! Expectations were for the CBRT to leave rates unchanged. This was the first time the central bank cut rates since December 2021, when it ended its string of consecutive rate cuts and lowered rates by a total of 500bps! The central bank noted that it sees inflation decreasing after the Russia/Ukraine war. Recall that Turkey’s President Erdogan had been instructing central bank governors to cut the main interest rate since inflation began rising after the pandemic. If they did not do as instructed, they were fired.
Over the weekend, the CBRT took steps to decrease the gap between its policy rate and lending rates. The central bank replaced an existing 20% RRR for credits with a higher 30% treasury bond collateral requirement (Reuters).
USD/TRY began trading aggressively higher in the fall of 2021 as inflation began moving rapidly back into the world economy. Price moved from a low 8.2640 on September 2nd, 2021 to a high of 18.4138 on December 20th, 2021. The pair then violently corrected over the next few days, retracing to 10.2491 by December 23rd. However, by mid-January of this year, USD/TRY leveled out near 13.15 before its slow price ascent during 2022. On Thursday, the date of the latest rate cut, the pair reached its highest level since December 20th at 18.1532.

Source: Tradingview, Stone X
Trade USD/TRY now: Login or Open a new account!
• Open an account in the UK
• Open an account in Australia
• Open an account in Singapore
On a 240-minute timeframe, USD/TRY has been rising in an ascending wedge formation since late June. The expected breakout of an ascending wedge is lower. If price is to move lower, it must first break through the horizontal support at 17.6731. Below there, price can fall to the bottom, upward sloping trendline of the wedge bear 17.6000 and then additional horizontal support at 17.2684. However, if the pair continues higher, there is a confluence of resistance just above at the 127.2% Fibonacci extension level from the highs of June 19th to the lows of June 27th near 18.2167 and the top upward sloping trendline of the wedge near 18.2167. Above there, USD/TRY can move to the highs from December 2021 at 18.4138, then the 161.8% Fibonacci extension from the previously mentioned timeframe at 18.7962.
Source: Tradingview, Stone X
After last weeks surprise rate cut by the CBRT, USD/TRY moved to its highest level since December 20th, 2021. Could the pair take out the previous highs? With inflation continuing to increase and the central bank continuing to cut rates, it makes sense that the pair will continue higher. However, remember that the market doesn’t always act rational!
Learn more about forex trading opportunities.
Related tags:


Open an account in minutes
Experience award-winning platforms with fast and secure execution, and enjoy tight spreads from 0.5 pts on FX and 0.3 pts on indices.
Economic calendar
Web Trader platform
Our sophisticated web-based platform is packed with features.
Related articles
USD/CAD shooting star puts September surge on notice
USD/CAD has printed a clear bearish reversal pattern after an extraordinary September surge, but confirmation may depend heavily on how US Treasury yields react to Friday’s payrolls report.

USD/CHF Reverses as Swiss Franc Surges amid Bond Carnage
USD/CHF reverses from channel resistance as bond volatility surges and broad Swiss franc strength points to a possible carry-trade unwind.


USD/MXN Analysis: Is Super Peso Starting to Fade?
Over recent trading sessions, the Mexican peso has continued to show signs of weakness against the U.S. dollar. This can already be seen in USD/MXN, which has gained more than 1.7% over the last three sessions, highlighting sustained buying pressure in favor of the dollar in the short term.

This report is intended for general circulation only. It should not be construed as a recommendation, or an offer (or solicitation of an offer) to buy or sell any financial products. The information provided does not take into account your specific investment objectives, financial situation or particular needs. Before you act on any recommendation that may be contained in this report, independent advice ought to be sought from a financial adviser regarding the suitability of the investment product, taking into account your specific investment objectives, financial situation or particular needs.
StoneX Financial Pte. Ltd., may distribute reports produced by its respective foreign entities or affiliates within the StoneX group of companies or third parties pursuant to an arrangement under Regulation 32C of the Financial Advisers Regulations. Where the report is distributed to a person in Singapore who is not an accredited investor, expert investor or an institutional investor (as defined in the Securities Futures Act), StoneX Financial Pte. Ltd. accepts legal responsibility to such persons for the contents of the report only to the extent required by law. Singapore recipients should contact StoneX Financial Pte. Ltd. at 6826 9988 for matters arising from, or in connection with the report.
In the case of all other recipients of this report, to the extent permitted by applicable laws and regulations neither StoneX Financial Pte. Ltd. nor its associated companies will be responsible or liable for any loss or damage incurred arising out of, or in connection with, any use of the information contained in this report and all such liability is hereby expressly disclaimed. No representation or warranty is made, express or implied, that the content of this report is complete or accurate.
StoneX Financial Pte. Ltd. is not under any obligation to update this report.
Trading CFDs carries a high level of risk that may not be suitable for some investors. Consider your investment objectives, level of experience, financial resources, risk appetite and other relevant circumstances carefully. The possibility exists that you could lose some or all of your investments, including your initial deposits. If in doubt, please seek independent expert advice. Visit www.forex.com/en-sg/terms-and-policies for the complete Risk Disclosure Statement.