


Crude oil forecast: How much further can WTI fall?
Oil prices initially opened higher following weekend reports that Iran had once again moved to restrict activity through the Strait of Hormuz. However, that early strength quickly faded, with crude retreating towards levels seen at the end of last week. At the time of writing, WTI crude was down around 2.5%, hovering near intraday lows. Part of the weakness reflects the fact that the strait was not completely shut, despite shipping data showing a notable decline in vessel traffic. More importantly, investors have responded positively to diplomatic developments in the region.
Share this:
Oil prices initially opened higher following weekend reports that Iran had once again moved to restrict activity through the Strait of Hormuz. However, that early strength quickly faded, with crude retreating towards levels seen at the end of last week. At the time of writing, WTI crude was down around 2.5%, hovering near intraday lows. Part of the weakness reflects the fact that the strait was not completely shut, despite shipping data showing a notable decline in vessel traffic. More importantly, investors have responded positively to diplomatic developments in the region. The first round of talks between Washington and Tehran concluded with what Iranian Foreign Minister Abbas Araghchi described as “major progress” while securing a ceasefire in Lebanon also appeared to advance. With efforts towards a lasting peace ongoing, this could put further pressure on crude oil forecast in the near-term. That said, the scope for a deeper sell-off may be limited given that much of the geopolitical premium has already been removed from prices and underlying demand remains resilient.
Inventory rebuilding could help stabilise the market
For now, the market’s immediate direction still appears tilted to the downside as tensions in the Middle East ease. Crude has already surrendered most of the gains accumulated during the conflict period. Oil prices are now approaching the range that prevailed before disruptions intensified, suggesting that most of the war-related premium has been priced out. Prior to the war, WTI was trading in the $65-$66 per barrel region, an area that could provide meaningful support if prices continue to retreat.
However, the disruptions affecting the Strait of Hormuz over recent months has created a significant imbalance between supply and demand, tightening global markets and reducing available inventories. So, even if WTI were to return to pre-war levels, don’t expect it to continue heading south.
For one thing, releases from strategic reserves, which helped offset some of the supply shortfall experienced during the disruption, will need to be replenished. As prices retreat, many countries will likely look to rebuild inventories that were drawn down during the period of heightened uncertainty. Major consumers including China, Japan and the United States may take advantage of lower prices to replenish reserves. Such buying activity could provide an important source of support for the crude oil forecast over the coming weeks.
That said, stronger demand may be partly offset by rising output from producers including Iran and Venezuela. Unless geopolitical tensions flare up again, additional supply could cap any meaningful upside in prices.
Another factor worth watching is the US dollar. A stronger greenback typically weighs on dollar-denominated commodities, creating an additional headwind for both oil and precious metals.
Why a sharp collapse still looks unlikely
While further near-term downside cannot be ruled out, the conditions for a dramatic collapse in oil prices do not appear to be in place.
The direction of the crude oil forecast from here will largely depend on how supply growth balances against demand trends. On the consumption side, several supportive factors remain intact.
Strategic reserve replenishment programmes are likely to generate fresh demand, while the US summer driving season should continue to underpin fuel consumption. Seasonal strength in gasoline demand could help keep inventories relatively tight, even as OPEC members and Iran gradually increase production.
As a result, any additional weakness in crude may prove more measured than aggressive, particularly if demand remains robust through the third quarter, or if the return to pre-war production levels prove to be more difficult than expected.
WTI technical outlook
From a technical perspective, WTI has been trending lower for several weeks, leaving momentum indicators increasingly stretched to the downside.
That raises the possibility of a corrective rebound on oil prices, particularly if geopolitical tensions re-emerge and threaten supply routes through the Strait of Hormuz or other strategically important areas.
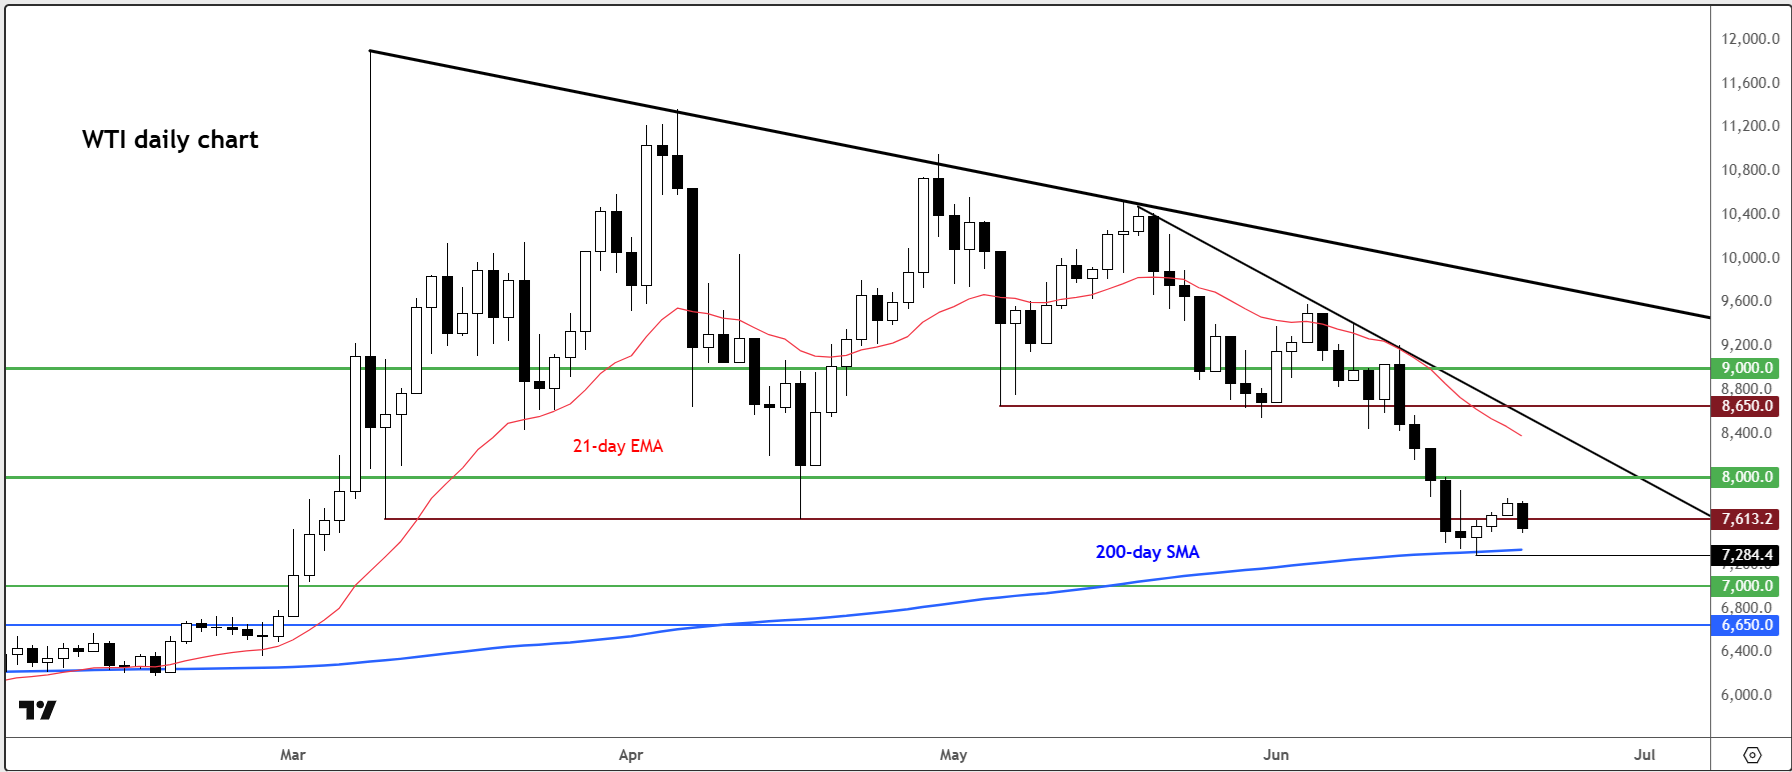
WTI was testing the $73-$74 per barrel region at the time of writing. This area represents a support zone as prices managed to hold above here during the final sessions of last week, while the 200-day moving average is also located nearby, reinforcing its significance.
Should that support fail, attention would likely shift towards the psychologically important $70 level. Below that, traders may focus on the pre-conflict trading range near $66-67 per barrel.
On the upside, the first key resistance level comes in around $76.10. This area acted as support earlier in the year before eventually giving way, and recent price action suggests it is now functioning as resistance.
A move above $76.10 would improve the short-term technical outlook and could open the door to a recovery towards $80 per barrel. In the event of a significant resurgence in Middle East tensions, a move into the $85-$86 region cannot be ruled out.

-- Written by Fawad Razaqzada, Market Analyst
Follow Fawad on Twitter @Trader_F_R
Related tags:
Latest market news




Open an account in minutes
Experience award-winning platforms with fast and secure execution, and enjoy tight spreads from 0.5 pts on FX and 0.3 pts on indices.
Economic calendar
Web Trader platform
Our sophisticated web-based platform is packed with features.
Related articles
Gold weekly outlook: XAU/USD holds above $4,000 despite strong US jobs data
Gold has held above $4,000 despite a much stronger-than-expected October jobs report. Fawad Razaqzada explains why lower yields and the tech sell-off have supported the metal, and why next week's US CPI could decide its next move.
Australian Dollar Short-term Outlook: AUD/USD 3% Plunge Puts Multi-Month Range at Risk 11 6 2026
A sharp equity-led selloff has driven AUD/USD toward critical June-low support, with strong NFP data adding pressure ahead of next week’s U.S. CPI.

Nasdaq 100 forecast: Tech stocks rebound but AI concerns linger
The Nasdaq 100 rebound has run into former support as fears over AI regulation and spending linger. Fawad Razaqzada explains why he maintains a cautious forecast and where the key levels sit.
This report is intended for general circulation only. It should not be construed as a recommendation, or an offer (or solicitation of an offer) to buy or sell any financial products. The information provided does not take into account your specific investment objectives, financial situation or particular needs. Before you act on any recommendation that may be contained in this report, independent advice ought to be sought from a financial adviser regarding the suitability of the investment product, taking into account your specific investment objectives, financial situation or particular needs.
StoneX Financial Pte. Ltd., may distribute reports produced by its respective foreign entities or affiliates within the StoneX group of companies or third parties pursuant to an arrangement under Regulation 32C of the Financial Advisers Regulations. Where the report is distributed to a person in Singapore who is not an accredited investor, expert investor or an institutional investor (as defined in the Securities Futures Act), StoneX Financial Pte. Ltd. accepts legal responsibility to such persons for the contents of the report only to the extent required by law. Singapore recipients should contact StoneX Financial Pte. Ltd. at 6826 9988 for matters arising from, or in connection with the report.
In the case of all other recipients of this report, to the extent permitted by applicable laws and regulations neither StoneX Financial Pte. Ltd. nor its associated companies will be responsible or liable for any loss or damage incurred arising out of, or in connection with, any use of the information contained in this report and all such liability is hereby expressly disclaimed. No representation or warranty is made, express or implied, that the content of this report is complete or accurate.
StoneX Financial Pte. Ltd. is not under any obligation to update this report.
Trading CFDs carries a high level of risk that may not be suitable for some investors. Consider your investment objectives, level of experience, financial resources, risk appetite and other relevant circumstances carefully. The possibility exists that you could lose some or all of your investments, including your initial deposits. If in doubt, please seek independent expert advice. Visit www.forex.com/en-sg/terms-and-policies for the complete Risk Disclosure Statement.