



Crude Oil, Nasdaq, NVDA Outlook: Will Rising Oil Prices Cap the AI Rally?
Crude Oil, Nasdaq, NVDA Outlook: Crude oil prices remain elevated near the $100 mark as Nvidia (NVDA) earnings expectations surpass $78 billion. Latest outlook for crude oil, Nasdaq, and NVDA amid rising bond yields, inflation concerns, and Middle East tensions.
Share this:

Will rising oil prices cap the AI rally as bullish NVDA earnings expectations climb in a rising bond yield environment? Price action remains critical for confirming the next directional breakout across crude oil, Nasdaq, and Nvidia.
- NVDA earnings are expected to surpass $78 billion
- Concerns over priced-in AI optimism are rising as signs of market slowdown emerge on the charts
- Nasdaq pulled back over 3% from the 29,700 resistance/high while NVDA retreated over 7% from the 237 resistance/high
- Crude oil prices continue to hold near the $100 mark, adding pressure to inflation and bond yield expectations amid the upcoming FOMC minutes
Crude Oil Price Outlook: Weekly Time Frame – Log Scale
Source: Trading view
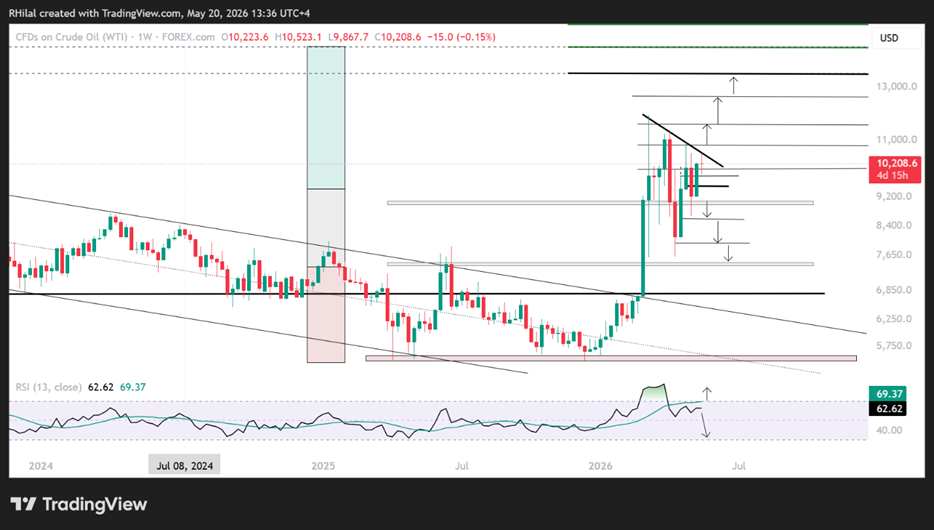
Crude oil price action continues to hold near the $100 mark, challenging the resistance trendline connecting the lower highs since March 2026. This keeps bullish breakout risks in focus should a sustained hold above the 108 level re-emerge, potentially weighing further on bond markets and limiting gains across markets, including the Nasdaq and Nvidia.
The inflationary environment is not driven solely by crude oil prices. Fertilizers, shipping costs, and broader supply chain pressures are also contributing. However, crude oil price action continues to reflect the direction of the Middle East conflict, keeping key intermarket scenarios in focus that could inversely impact the Nasdaq and NVDA.
Bullish Scenario for Crude Oil
A sustained breakout above 108 and 115 could expose another leg higher this year toward 126, 135, and 157. These levels align with the Fibonacci extension ratios of 0.618, 0.786, and 100% of the 2020–2022–2026 cycle.
This scenario would likely add further pressure to recent drawdowns across risk assets and the broader technology rally.
Bearish Scenario for Crude Oil
A sustained hold below the 2023 highs near the 88–91 barrier would reinforce the de-escalation narrative, exposing prices back toward 86, 82, and 79 before potentially retesting the previous Middle East conflict high near 76 for either another rebound or an extended bearish continuation.
This scenario would likely ease inflationary pressures across markets, allowing risk asset trends to resume should central bank policy shift toward a less hawkish stance
Nasdaq Price Outlook: Weekly Time Frame – Log Scale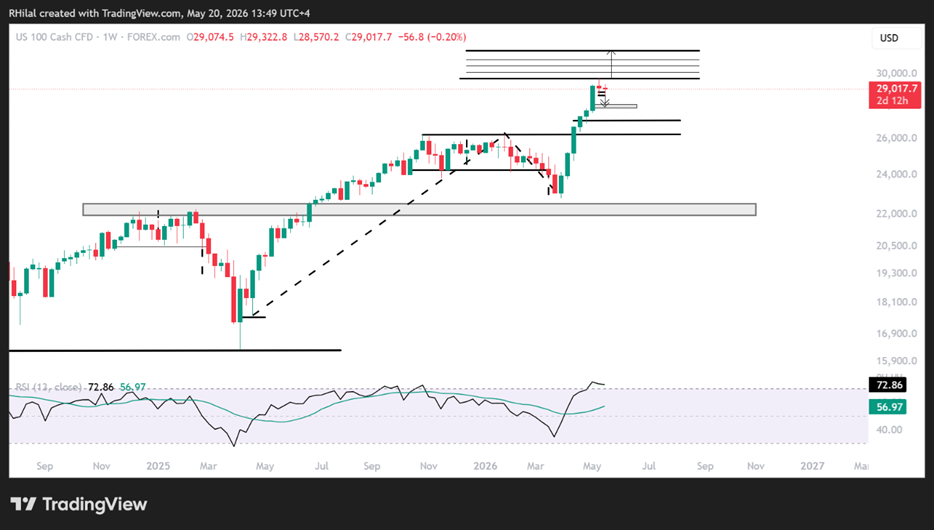
Source: Trading view
Nasdaq remains below the 78.6% Fibonacci extension of the April 2021 2025 – October 2025 – March 2026 cycle.
Bullish Scenario for Nasdaq
A sustained hold back above 29,700 would expose gains toward the 30,100 psychological mark, followed by 30,500 and 30,900 as short-term resistance levels. The 31,500 level, aligning with the 100% Fibonacci extension, remains a higher probability setup for the next major resistance zone.
Bearish Scenario for Nasdaq
A sustained hold below 28,600 exposes downside risks toward 28,000, 27,800, and 27,000, aligning with Fibonacci retracement ratios of the impulse move between this year’s lows and highs, March-May 2026.
The more extreme bearish scenario would target the 50% retracement near the highs of the 2025–2026 consolidation around 26,200, which remains a higher probability zone for a bullish rebound setup / dip buying opportunity.
Related video: Nasdaq Rally Faces Inflation Risks as Bond Yields Threaten AI Momentum
NVDIA Price Outlook: Daily Time Frame – Log Scale
Source: Trading view
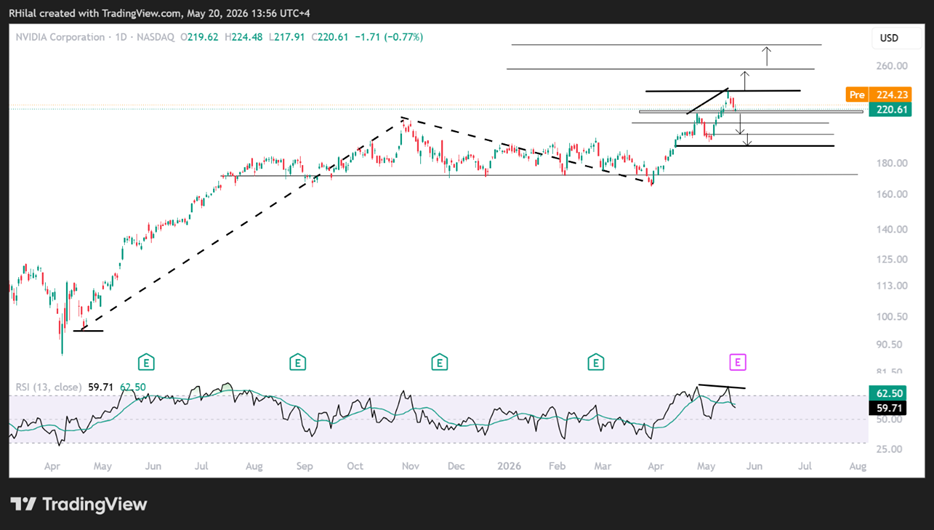
NVDA continues to trade in a similar structure to the Nasdaq, remaining below the 237 resistance level, which aligns with the 0.618 Fibonacci extension of the wave between April 2021, October 2025, and March 2026.
Bullish Scenario for NVDA
A sustained hold above the 237 mark exposes upside potential toward the 78.6% and 100% Fibonacci extension ratios near 256 and 287.
Bearish Scenario for NVDA
In line with the bearish divergence and overbought RSI conditions on the daily time frame, a sustained hold below the 217 support level — a previously respected resistance and the 0.272 Fibonacci retracement ratio of this year’s uptrend — exposes downside risks toward 209, 200.60, and 192.
The 192 zone remains a higher probability rebound setup, aligning with the 0.618 Fibonacci retracement ratio.
Price action and intermarket confirmation will remain critical in navigating the noise between AI demand, the implications of the Middle East conflict, and the shifting sentiment surrounding US-Iran tensions.
Written by Razan Hilal, CMT
Follow on X: @Rh_waves



Open an account in minutes
Experience award-winning platforms with fast and secure execution, and enjoy tight spreads from 0.5 pts on FX and 0.3 pts on indices.
Economic calendar
Web Trader platform
Our sophisticated web-based platform is packed with features.
Related articles

USD/JPY weekly outlook: Quarter turn scrambles rates regime
USD/JPY’s tight relationship with front-end US rates broke down sharply last week, but quarter-turn flows and positioning suggest the disconnect may prove temporary.


Dow Jones Forecast: DJIA rises after weaker jobs data
U.S. stocks are rising after weaker-than-expected U.S. jobs data saw markets rein in rate hike expectations.


What Stretched 10-Year Yields Mean for Major Currency Pairs in Q4
U.S. 10-year Treasury yields are nearing a long-term resistance zone with overbought RSI readings, raising near-term pullback risk for the dollar.
This report is intended for general circulation only. It should not be construed as a recommendation, or an offer (or solicitation of an offer) to buy or sell any financial products. The information provided does not take into account your specific investment objectives, financial situation or particular needs. Before you act on any recommendation that may be contained in this report, independent advice ought to be sought from a financial adviser regarding the suitability of the investment product, taking into account your specific investment objectives, financial situation or particular needs.
StoneX Financial Pte. Ltd., may distribute reports produced by its respective foreign entities or affiliates within the StoneX group of companies or third parties pursuant to an arrangement under Regulation 32C of the Financial Advisers Regulations. Where the report is distributed to a person in Singapore who is not an accredited investor, expert investor or an institutional investor (as defined in the Securities Futures Act), StoneX Financial Pte. Ltd. accepts legal responsibility to such persons for the contents of the report only to the extent required by law. Singapore recipients should contact StoneX Financial Pte. Ltd. at 6826 9988 for matters arising from, or in connection with the report.
In the case of all other recipients of this report, to the extent permitted by applicable laws and regulations neither StoneX Financial Pte. Ltd. nor its associated companies will be responsible or liable for any loss or damage incurred arising out of, or in connection with, any use of the information contained in this report and all such liability is hereby expressly disclaimed. No representation or warranty is made, express or implied, that the content of this report is complete or accurate.
StoneX Financial Pte. Ltd. is not under any obligation to update this report.
Trading CFDs carries a high level of risk that may not be suitable for some investors. Consider your investment objectives, level of experience, financial resources, risk appetite and other relevant circumstances carefully. The possibility exists that you could lose some or all of your investments, including your initial deposits. If in doubt, please seek independent expert advice. Visit www.forex.com/en-sg/terms-and-policies for the complete Risk Disclosure Statement.