



Crude Oil Weekly Outlook: Diamond Breakdown Stalling Near $86?
Crude Oil Weekly Outlook: Is a diamond breakdown stalling on the crude oil chart near $86? Bearish reversal signals are emerging, yet downside momentum appears to be stalling.
Share this:
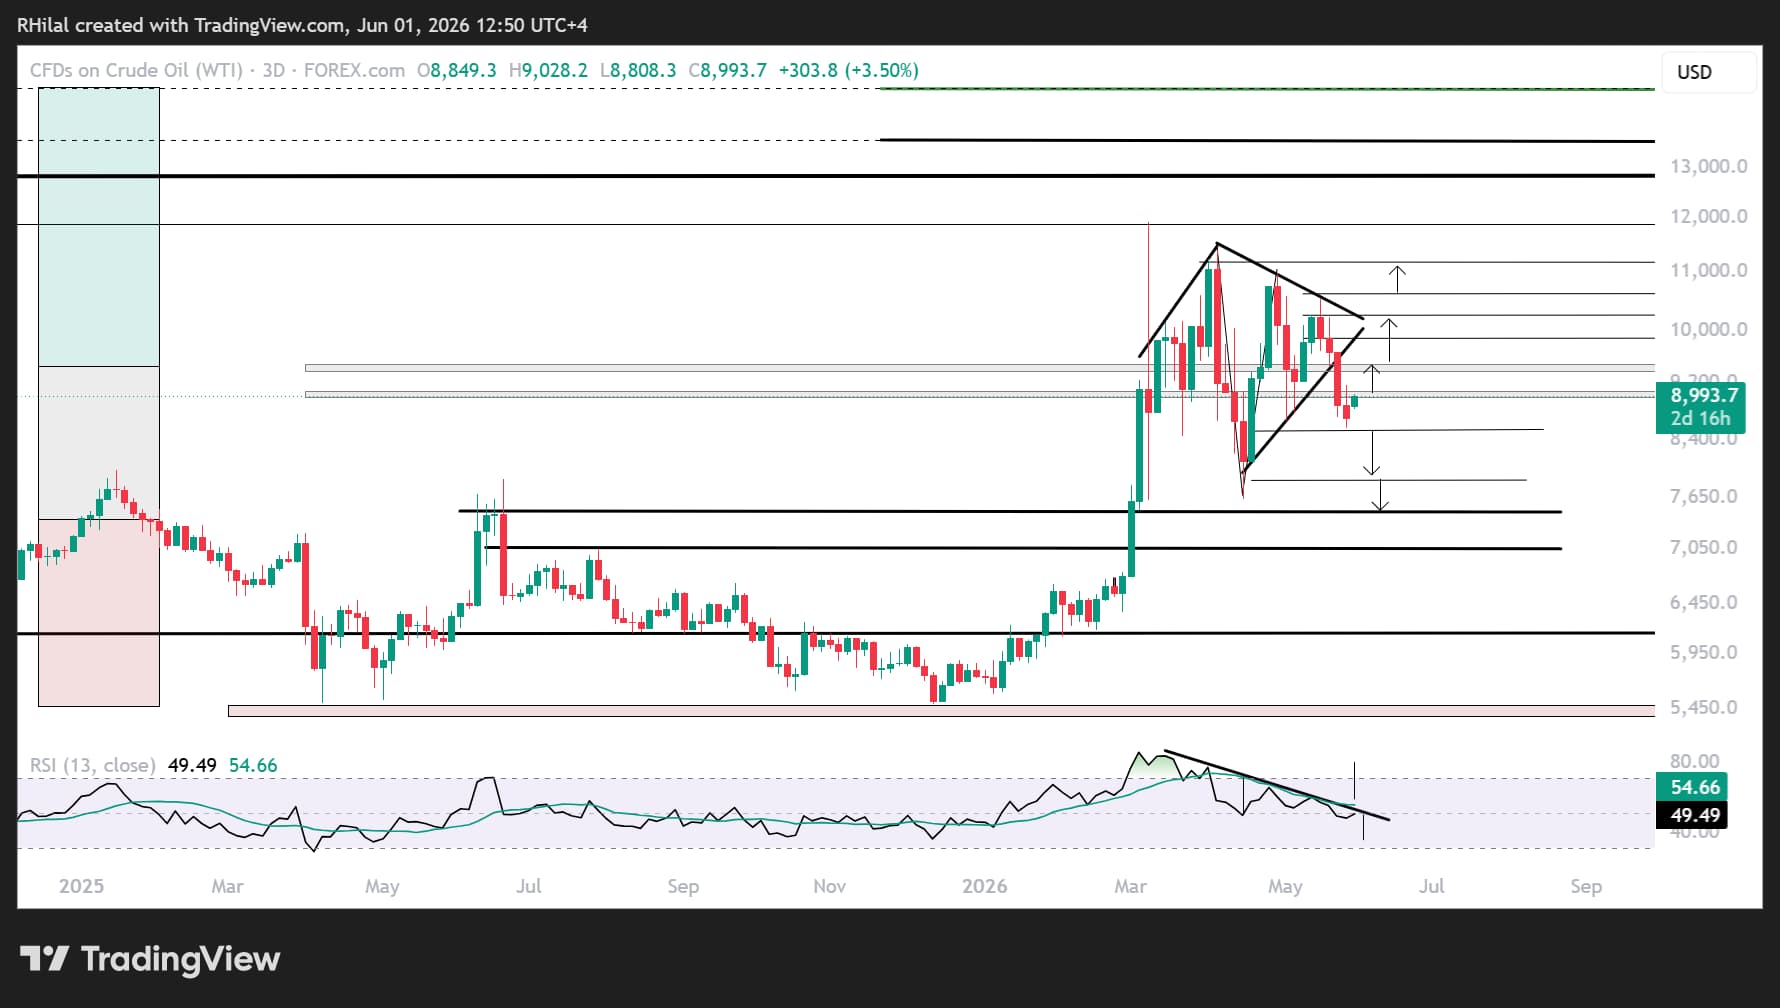
A bearish diamond reversal pattern has been developing on the crude oil chart since mid-May. Following the broadening price volatility witnessed between March and April 2026, price action contracted into mid-May, increasing the risk of a bearish drawdown similar to the recent move in gold. Markets are increasingly pricing in a near-term agreement between the United States and Iran, while geopolitical sentiment surrounding the Middle East conflict appears to be reaching exhaustion ahead of the summer season.
Factors to Watch for Crude Oil Price Volatility
- Summer demand and crude oil inventory trends
- A mutual agreement between the United States and Iran involving safe passage through the Strait of Hormuz
- Alternative export routes that could bypass the Strait of Hormuz and return disrupted crude supplies to global markets
- Sanctions on Russian and Iranian oil, which may either amplify black-market shipping activity or reintroduce unsanctioned supply into the market
In conclusion, crude oil remains a story of supply and demand, with sentiment often leading market positioning. These shifts are reflected in chart patterns and price action, recently highlighted by a multi-month consolidation and a developing diamond reversal pattern.
Crude Oil Weekly Outlook: 3-Day Time Frame – Log Scale
Source: TradingView
Crude oil price action remains below a multi-month consolidation range and under the $93 level, the 2023 high, increasing the risk of a sharp decline comparable to the steep advance that preceded the consolidation near this year's highs. This development provides some relief to bond markets; however, bullish risks remain on the table as crude oil continues to hold above the key $86 support level, and strikes in the Middle East continue, preventing full confirmation of the bearish reversal. This aligns with the persistence of geopolitical tensions and military strikes across the Middle East.
The current inflationary environment is not driven solely by crude oil prices. Fertilizers, shipping costs, and broader supply-chain pressures continue to contribute to inflationary trends. However, crude oil price action remains highly sensitive to developments surrounding the Middle East conflict, spilling over to key intermarket scenarios that could have significant implications across global markets.
Bullish Scenario for Crude Oil
A sustained breakout above $95, $105, and $115 could expose another leg higher this year toward $126, $135, and $157. These levels align with the Fibonacci extension ratios of 61.8%, 78.6%, and 100% of the 2020–2022–2026 cycle.
Such a scenario would likely increase pressure on global currencies against the U.S. dollar, support precious metals, and potentially divert risk sentiment away from AI-related assets.
The bullish outlook would align with both RSI and price-action breakouts above the trendline connecting the lower highs formed since March, potentially setting the stage for one final rally.
Bearish Scenario for Crude Oil
A sustained hold below the 2023 highs near the $88–$91 resistance zone would keep the de-escalation narrative in focus. This scenario would be confirmed by closes below $86, $82, and $79, opening the door for a retest of the previous Middle East conflict high near $76. From there, crude oil could either stage another rebound or extend its decline toward $67.
The bearish scenario would likely align with continued RSI weakness, characterized by lower highs since March 2026 and sustained trading below the neutral 50 level. This would confirm a potential diagonal pattern breakdown, raising the risk of a decline comparable in magnitude to the sharp advance that preceded the pattern's formation, aligning with the $67 downside target.
Such a scenario would likely ease inflationary pressures across global markets, allowing risk assets to regain momentum, particularly if central banks shift toward a less hawkish policy stance.
Written by Razan Hilal, CMT
Follow on X: @Rh_waves
Open an account in minutes
Experience award-winning platforms with fast and secure execution, and enjoy tight spreads from 0.5 pts on FX and 0.3 pts on indices.
Economic calendar
Web Trader platform
Our sophisticated web-based platform is packed with features.
Related articles

Crude Oil, DXY Outlook: Geopolitical Risks Halt Sell-Offs in the Dollar and Oil
The U.S. Dollar Index, Brent and WTI are rebounding from key support levels and oversold conditions after steep sell-offs. U.S.–Iran tensions, inflation risks and rate expectations remain in focus.

Silver's bullish breakout case builds as bond yields retreat
The Democratic blue wave has sent crude and Treasury yields sharply lower, improving the outlook for precious metals. With gold already breaking higher, could silver be next?


Gold Reclaims $4,000, Bulls Eye Reversal with Seasonality Tailwind
Gold futures rebound above $4,000 as falling US yields, improving sentiment and bullish seasonality raise hopes of a significant reversal.

This report is intended for general circulation only. It should not be construed as a recommendation, or an offer (or solicitation of an offer) to buy or sell any financial products. The information provided does not take into account your specific investment objectives, financial situation or particular needs. Before you act on any recommendation that may be contained in this report, independent advice ought to be sought from a financial adviser regarding the suitability of the investment product, taking into account your specific investment objectives, financial situation or particular needs.
StoneX Financial Pte. Ltd., may distribute reports produced by its respective foreign entities or affiliates within the StoneX group of companies or third parties pursuant to an arrangement under Regulation 32C of the Financial Advisers Regulations. Where the report is distributed to a person in Singapore who is not an accredited investor, expert investor or an institutional investor (as defined in the Securities Futures Act), StoneX Financial Pte. Ltd. accepts legal responsibility to such persons for the contents of the report only to the extent required by law. Singapore recipients should contact StoneX Financial Pte. Ltd. at 6826 9988 for matters arising from, or in connection with the report.
In the case of all other recipients of this report, to the extent permitted by applicable laws and regulations neither StoneX Financial Pte. Ltd. nor its associated companies will be responsible or liable for any loss or damage incurred arising out of, or in connection with, any use of the information contained in this report and all such liability is hereby expressly disclaimed. No representation or warranty is made, express or implied, that the content of this report is complete or accurate.
StoneX Financial Pte. Ltd. is not under any obligation to update this report.
Trading CFDs carries a high level of risk that may not be suitable for some investors. Consider your investment objectives, level of experience, financial resources, risk appetite and other relevant circumstances carefully. The possibility exists that you could lose some or all of your investments, including your initial deposits. If in doubt, please seek independent expert advice. Visit www.forex.com/en-sg/terms-and-policies for the complete Risk Disclosure Statement.