


Gold Reclaims $4,000, Bulls Eye Reversal with Seasonality Tailwind
Gold futures rebound above $4,000 as falling US yields, improving sentiment and bullish seasonality raise hopes of a significant reversal.
Share this:

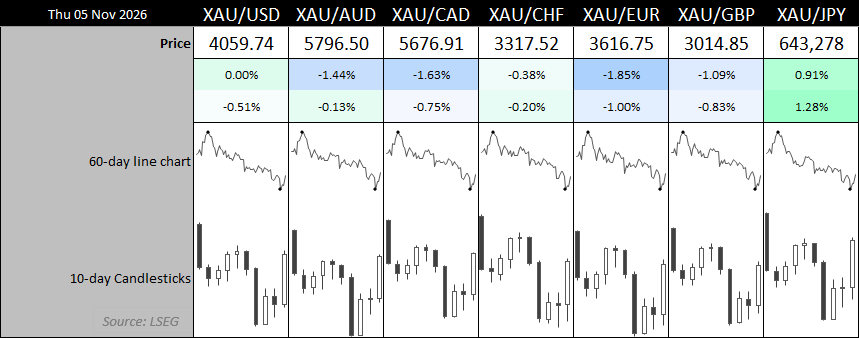
Gold futures have reclaimed $4,000 following the US midterms, raising the prospect of an important swing low. With a bullish engulfing week taking shape, improving options sentiment and favourable seasonality, the technical picture is becoming increasingly interesting for gold bulls.
View related analysis:
Gold’s $4,000 Rebound Gains Support from Seasonality and Sentiment
The Democrats’ blue sweep in the midterms weighed on US yields and the dollar on Thursday, helping gold futures rebound above $4,000. A sharp sell-off in crude oil also eased inflation concerns, allowing gold to rally alongside equities during the risk-on rebound. And the conviction behind the move suggests an important swing low could be in play.
My previous assumption that bulls were quietly accumulating above $4,000 was certainly put to the test, but perhaps that was the final washout of weak hands. Besides, futures traders remain net-long, while risk reversals are curling higher to show a pickup in demand for calls relative to puts. And with gold on track for a bullish engulfing week, the technical picture is becoming increasingly interesting. Particularly with seasonality on its side this time of the year.
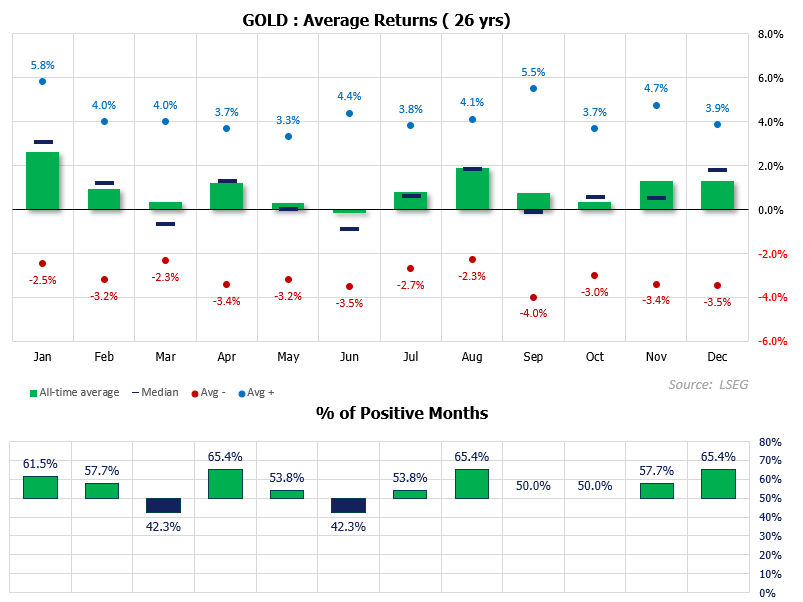
Could Gold’s Seasonality Favours a November Rebound?
- Since the year 2000, average returns for gold in November have been 1.3%, and it has closed higher 57.7% of the time. Of those bullish months, gold has printed an average return of 4.7%.
- Negative returns during November have averaged -3.4%, and it has closed lower 43.3% of the time.
- Median returns have been less impressive at 0.5%, though still positive regardless
- Also note that the win rate increases to 65.4% in December
Given we have seen a decent selloff on gold and potential false break of support, bullish seasonality may help gold bounce over the near term. Though a break of this week’s low provides a clear line in the sane for bulls.
This content was created by an affiliate of FOREX.com and represents the views and opinions of the author/speakers, not the views and opinions of FOREX.com, StoneX Group Inc., or its subsidiaries. The content has not been independently reviewed by FOREX.com.
Gold Futures Eye a Bullish Weekly Reversal
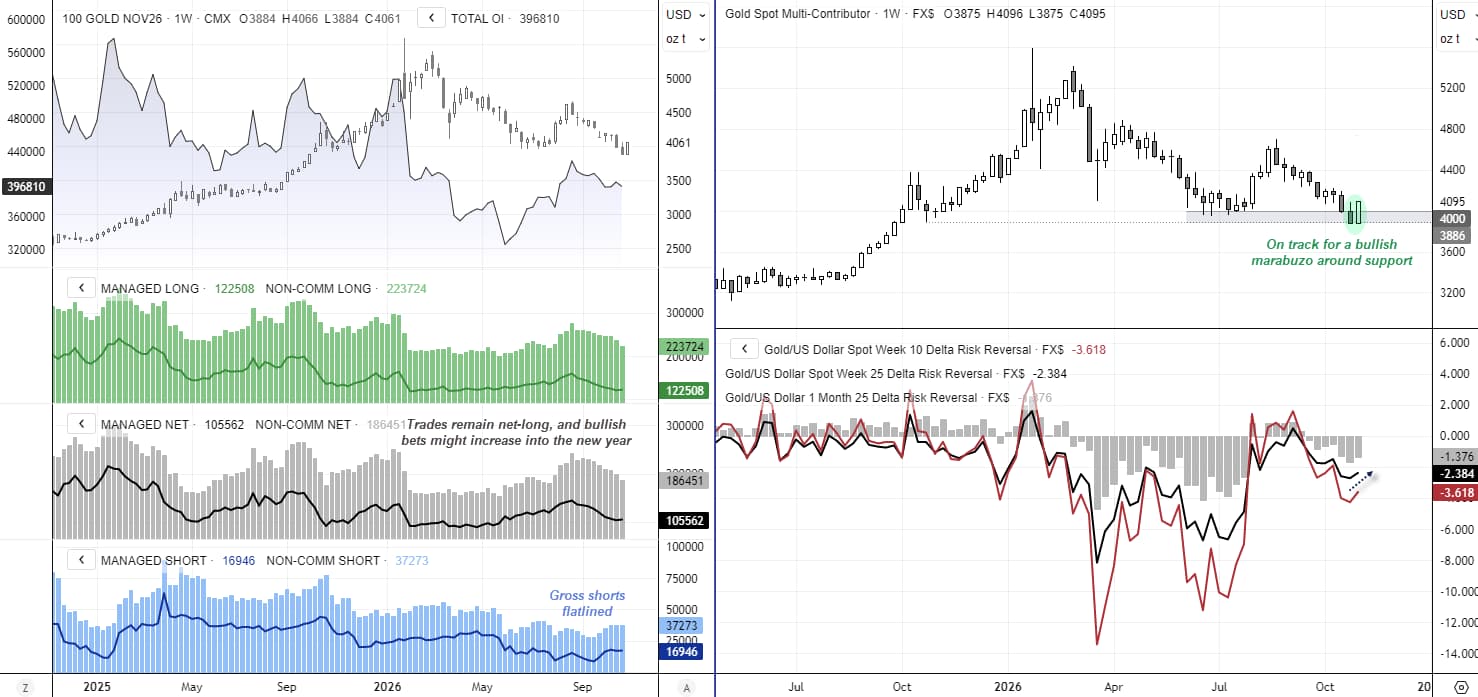
The weekly chart shows gold futures are on track for a bullish engulfing week, having opened at the low and now trading at the weekly high. Should gold rally into Friday's close, it could form a bullish Marubozu – a long bullish candle with little to no wicks.
COT Positioning and Risk Reversals Hint at Improving Sentiment
Note that the most recent futures positioning from the Commitments of Traders (COT) report shows traders remained net-long overall, though their gross longs have been trending lower since July. However, gross shorts have flatlined for the past three weeks, and the rebound may have forced some bears to cover and encouraged sidelined bulls to return.
While risk reversals remain negative – meaning puts continue to command a premium over calls – they are curling higher to show sentiment is becoming less bearish. And with a potential bullish engulfing candle marking a false break of support, perhaps gold can find a bullish tailwind in the coming weeks.

Gold Bulls Eye $4,142 and $4,185 Resistance
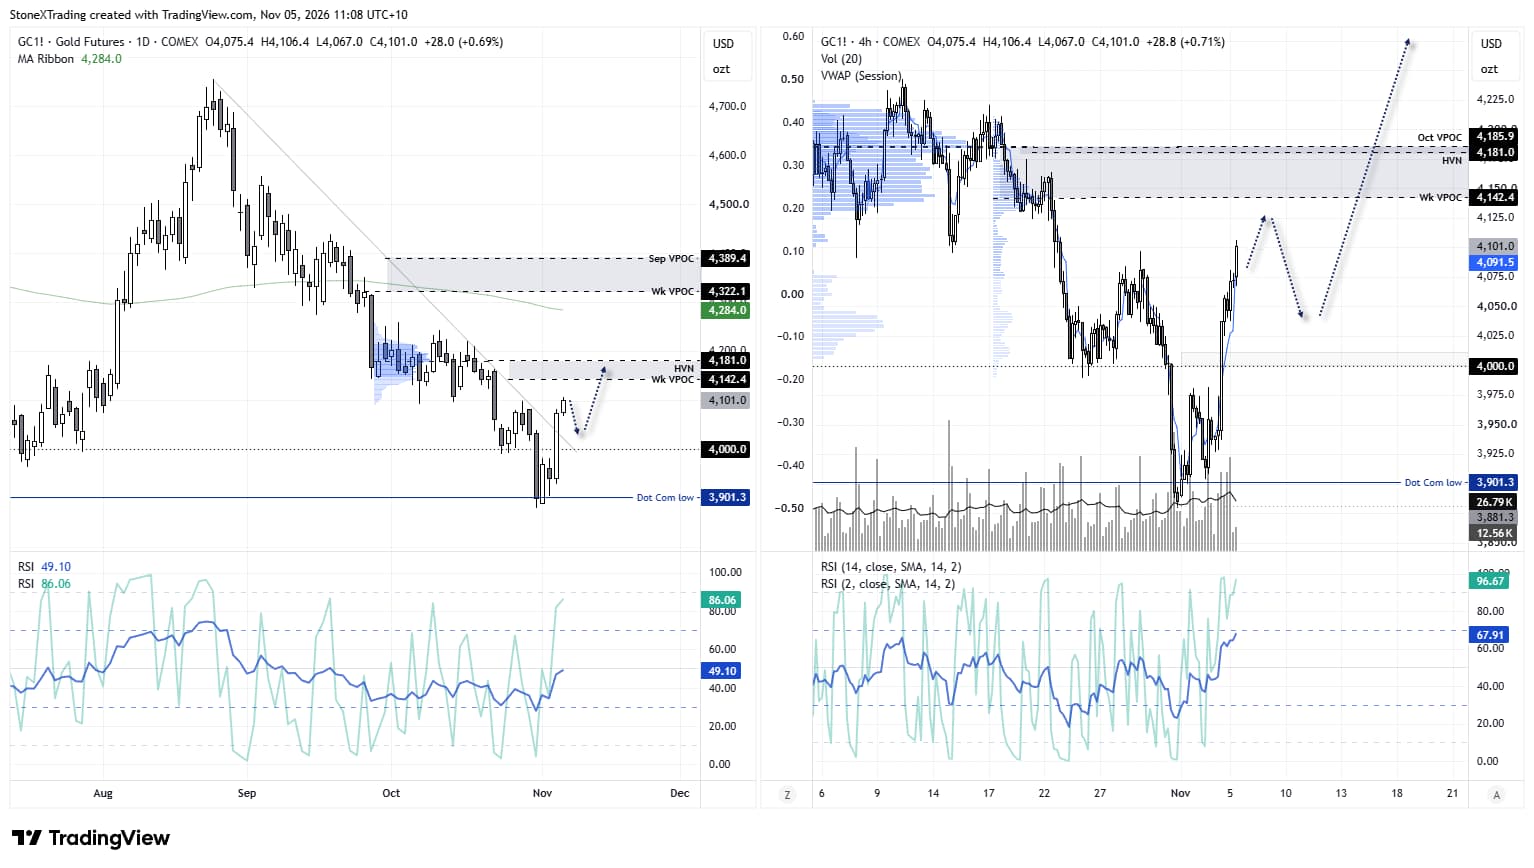
The daily chart shows Thursday's gold rally was accompanied by strong volume. Prices have risen above $4,100 during Asian trade, though bullish momentum may already be waning. Bulls may therefore be seeking a pullback closer to $4,000 or the broken trendline, with a view to initially targeting the weekly VPOC at $4,142, followed by the high-volume node and October VPOC around $4,185.
Related tags:
Latest market news




Open an account in minutes
Experience award-winning platforms with fast and secure execution, and enjoy tight spreads from 0.5 pts on FX and 0.3 pts on indices.
Economic calendar
Web Trader platform
Our sophisticated web-based platform is packed with features.
Related articles
Gold Reclaims $4,000, Bulls Eye Reversal with Seasonality Tailwind
Gold futures rebound above $4,000 as falling US yields, improving sentiment and bullish seasonality raise hopes of a significant reversal.
Swiss Franc Short-term Outlook: USD/CHF Selloff Nears Critical Support Ahead of NFP 11 4 2026
USD/CHF bears are closing in on critical trend support, with the next reaction likely to determine whether the October decline has further to run.


Euro Technical Outlook: EUR/USD Support Reversal Sets Up Breakout Test Ahead of NFP 11 4 2026
Euro bulls are attempting to build on the rebound from recent lows, but pivotal resistance still stands in the way of a larger EUR/USD recovery.
This report is intended for general circulation only. It should not be construed as a recommendation, or an offer (or solicitation of an offer) to buy or sell any financial products. The information provided does not take into account your specific investment objectives, financial situation or particular needs. Before you act on any recommendation that may be contained in this report, independent advice ought to be sought from a financial adviser regarding the suitability of the investment product, taking into account your specific investment objectives, financial situation or particular needs.
StoneX Financial Pte. Ltd., may distribute reports produced by its respective foreign entities or affiliates within the StoneX group of companies or third parties pursuant to an arrangement under Regulation 32C of the Financial Advisers Regulations. Where the report is distributed to a person in Singapore who is not an accredited investor, expert investor or an institutional investor (as defined in the Securities Futures Act), StoneX Financial Pte. Ltd. accepts legal responsibility to such persons for the contents of the report only to the extent required by law. Singapore recipients should contact StoneX Financial Pte. Ltd. at 6826 9988 for matters arising from, or in connection with the report.
In the case of all other recipients of this report, to the extent permitted by applicable laws and regulations neither StoneX Financial Pte. Ltd. nor its associated companies will be responsible or liable for any loss or damage incurred arising out of, or in connection with, any use of the information contained in this report and all such liability is hereby expressly disclaimed. No representation or warranty is made, express or implied, that the content of this report is complete or accurate.
StoneX Financial Pte. Ltd. is not under any obligation to update this report.
Trading CFDs carries a high level of risk that may not be suitable for some investors. Consider your investment objectives, level of experience, financial resources, risk appetite and other relevant circumstances carefully. The possibility exists that you could lose some or all of your investments, including your initial deposits. If in doubt, please seek independent expert advice. Visit www.forex.com/en-sg/terms-and-policies for the complete Risk Disclosure Statement.