





Dow Jones Forecast: DJIA Hits 40K – Will We See a Bounce?
The DJIA has fallen back to retest the psychologically-significant $40K level, which could now provide support for the index moving forward.
Share this:

DJIA Key Points
- All the major indices are trading lower, led by a -3% decline in the tech-heavy Nasdaq 100
- Yield curve “uninversions” have historically been a harbinger of a potential recession, and we’re closer to that signal than at any point in the last 2 years.
- DJIA has fallen back to retest the psychologically-significant $40K level, which could now provide support for the index moving forward.
Make no bones about it: Today has been a rough day for the US stock market.
All the major indices are trading lower, led by a -3% decline in the tech-heavy Nasdaq 100 in the wake of disappointing earnings from Tesla and (to a lesser extent) Alphabet. While soft earnings from Two of the so-called “Magnificent Seven” stocks is the proximate cause for the big selloff, we also saw a worse-than-expected 49.5 reading in the S&P Flash Manufacturing PMI survey out of the US, the lowest reading this year.
The steepening of the 10yr-2yr yield spread to its tightest level in over 2 years (14bps) is also playing a role in spooking investors, as yield curve “uninversions” have historically been a harbinger of a potential recession. Time will tell whether this cocktail of bearish indicators continues to weigh on indices, but as it stands, bears are holding the upper hand at the moment.
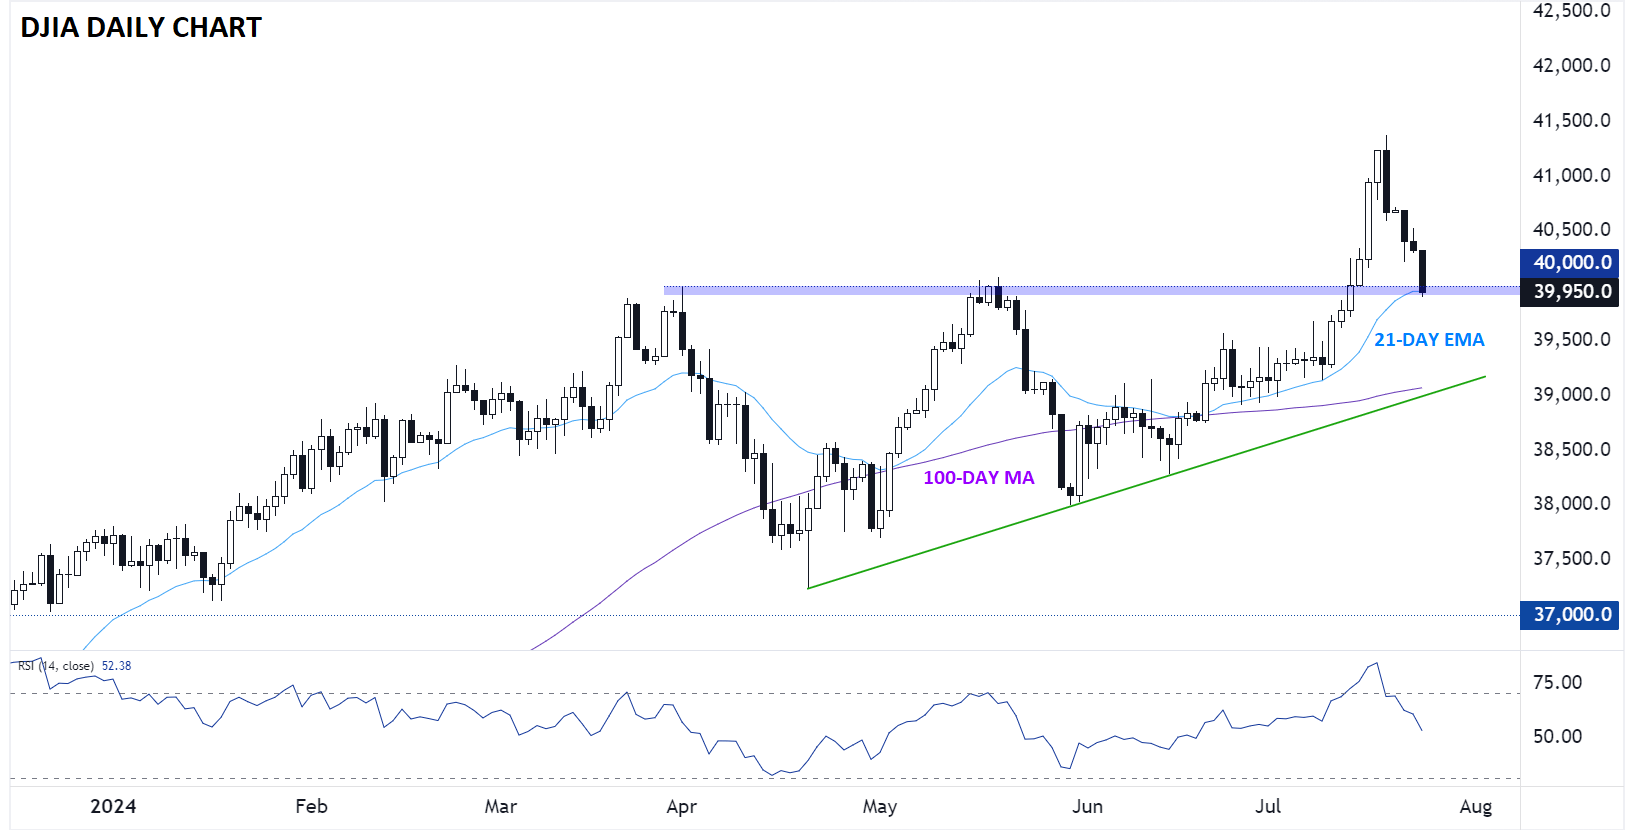
Dow Jones Industrial Average Technical Analysis – DJIA Daily Chart
Source: TradingView, StoneX
From a technical perspective, the DJIA has fallen back to retest the psychologically-significant $40K level as we go to press. This level, which served as key resistance in April and May, could now provide support for the index moving forward.
If we fail to see a bounce here, a deeper drop toward the 100-day MA and the rising trend line connecting the April, May, and June lows near $39K could be the next stop for the index.
-- Written by Matt Weller, Global Head of Research
Check out Matt’s Daily Market Update videos on YouTube and be sure to follow Matt on Twitter: @MWellerFX
Related tags:


Open an account in minutes
Experience award-winning platforms with fast and secure execution, and enjoy tight spreads from 0.5 pts on FX and 0.3 pts on indices.
Economic calendar
Web Trader platform
Our sophisticated web-based platform is packed with features.
Related articles

Dow Jones Slide Shows What Rate Hike Bets Mean for Stocks
The Dow Jones support breakdown shows rising bond yields and rate hike bets hitting U.S. stocks while tech giants prop up the Nasdaq.


Dow Jones Forecast: DJIA rises after weaker jobs data
U.S. stocks are rising after weaker-than-expected U.S. jobs data saw markets rein in rate hike expectations.


What Stretched 10-Year Yields Mean for Major Currency Pairs in Q4
U.S. 10-year Treasury yields are nearing a long-term resistance zone with overbought RSI readings, raising near-term pullback risk for the dollar.

This report is intended for general circulation only. It should not be construed as a recommendation, or an offer (or solicitation of an offer) to buy or sell any financial products. The information provided does not take into account your specific investment objectives, financial situation or particular needs. Before you act on any recommendation that may be contained in this report, independent advice ought to be sought from a financial adviser regarding the suitability of the investment product, taking into account your specific investment objectives, financial situation or particular needs.
StoneX Financial Pte. Ltd., may distribute reports produced by its respective foreign entities or affiliates within the StoneX group of companies or third parties pursuant to an arrangement under Regulation 32C of the Financial Advisers Regulations. Where the report is distributed to a person in Singapore who is not an accredited investor, expert investor or an institutional investor (as defined in the Securities Futures Act), StoneX Financial Pte. Ltd. accepts legal responsibility to such persons for the contents of the report only to the extent required by law. Singapore recipients should contact StoneX Financial Pte. Ltd. at 6826 9988 for matters arising from, or in connection with the report.
In the case of all other recipients of this report, to the extent permitted by applicable laws and regulations neither StoneX Financial Pte. Ltd. nor its associated companies will be responsible or liable for any loss or damage incurred arising out of, or in connection with, any use of the information contained in this report and all such liability is hereby expressly disclaimed. No representation or warranty is made, express or implied, that the content of this report is complete or accurate.
StoneX Financial Pte. Ltd. is not under any obligation to update this report.
Trading CFDs carries a high level of risk that may not be suitable for some investors. Consider your investment objectives, level of experience, financial resources, risk appetite and other relevant circumstances carefully. The possibility exists that you could lose some or all of your investments, including your initial deposits. If in doubt, please seek independent expert advice. Visit www.forex.com/en-sg/terms-and-policies for the complete Risk Disclosure Statement.