








DXY, EURUSD, Gold Forecast: Dollar Pressured at 3-Year Lows as Gold Powers to New Highs
DXY, EURUSD, Gold Forecast: Amid intensifying trade war tensions between the U.S. and China, the U.S. Dollar Index (DXY) remains anchored near 3-year lows, while Gold continues its record-breaking rally, defying overbought signals.
Share this:

Key Events:
- Gold breaks new records, exceeding $3,300/oz on haven demand
- Trade war risks deepen: U.S. halts NVIDIA chip exports; China retaliates with rare earth bans
- ECB Meeting (Thursday) and Powell’s speech (tonight) expected to spark volatility in EURUSD, DXY, and Gold
- China’s economic data beats expectations, showing resilience despite tariffs
US Dollar Index Holds at Critical Support Ahead of 2008 Trendline and ECB Decision
The U.S. Dollar Index (DXY) is currently hovering at 3-year lows, testing key support at 98, while EURUSD faces critical resistance at 1.15, a level that must be breached to confirm a stronger bullish trend. Trade tensions between the U.S. and China continue to weigh heavily on both economies, keeping the dollar subdued near 99, and EURUSD anchored near 1.13.
This is despite recent upbeat economic data from China showing resilience in the face of ongoing tariff disputes that have persisted since early 2025:
- GDP: Stabilized at 5.4%, beating expectations of 5.2%
- Industrial Production: Surged to 7.7%, above the 5.9% forecast
- Retail Sales: Rose to 5.9%, surpassing the 4.0% estimate
Meanwhile, Beijing has insisted on respect as a prerequisite for trade negotiations, while tensions have escalated further: the U.S. halted NVIDIA chip exports to China, and in response, China banned exports of rare earth minerals vital for U.S. defense manufacturing.
These developments add further downside risk to markets ahead of Thursday’s earnings reports from Netflix and TSMC. With geopolitical heat intensifying and Gold hitting record highs, markets are looking for signs of a potential trade resolution to sustain the rebound that began last Wednesday following the delay in tariff announcements. The upcoming speech from Fed Chair Jerome Powell tonight could introduce fresh catalysts into the markets.
Gold Extends Record Highs Towards 2016-2020 Trendline
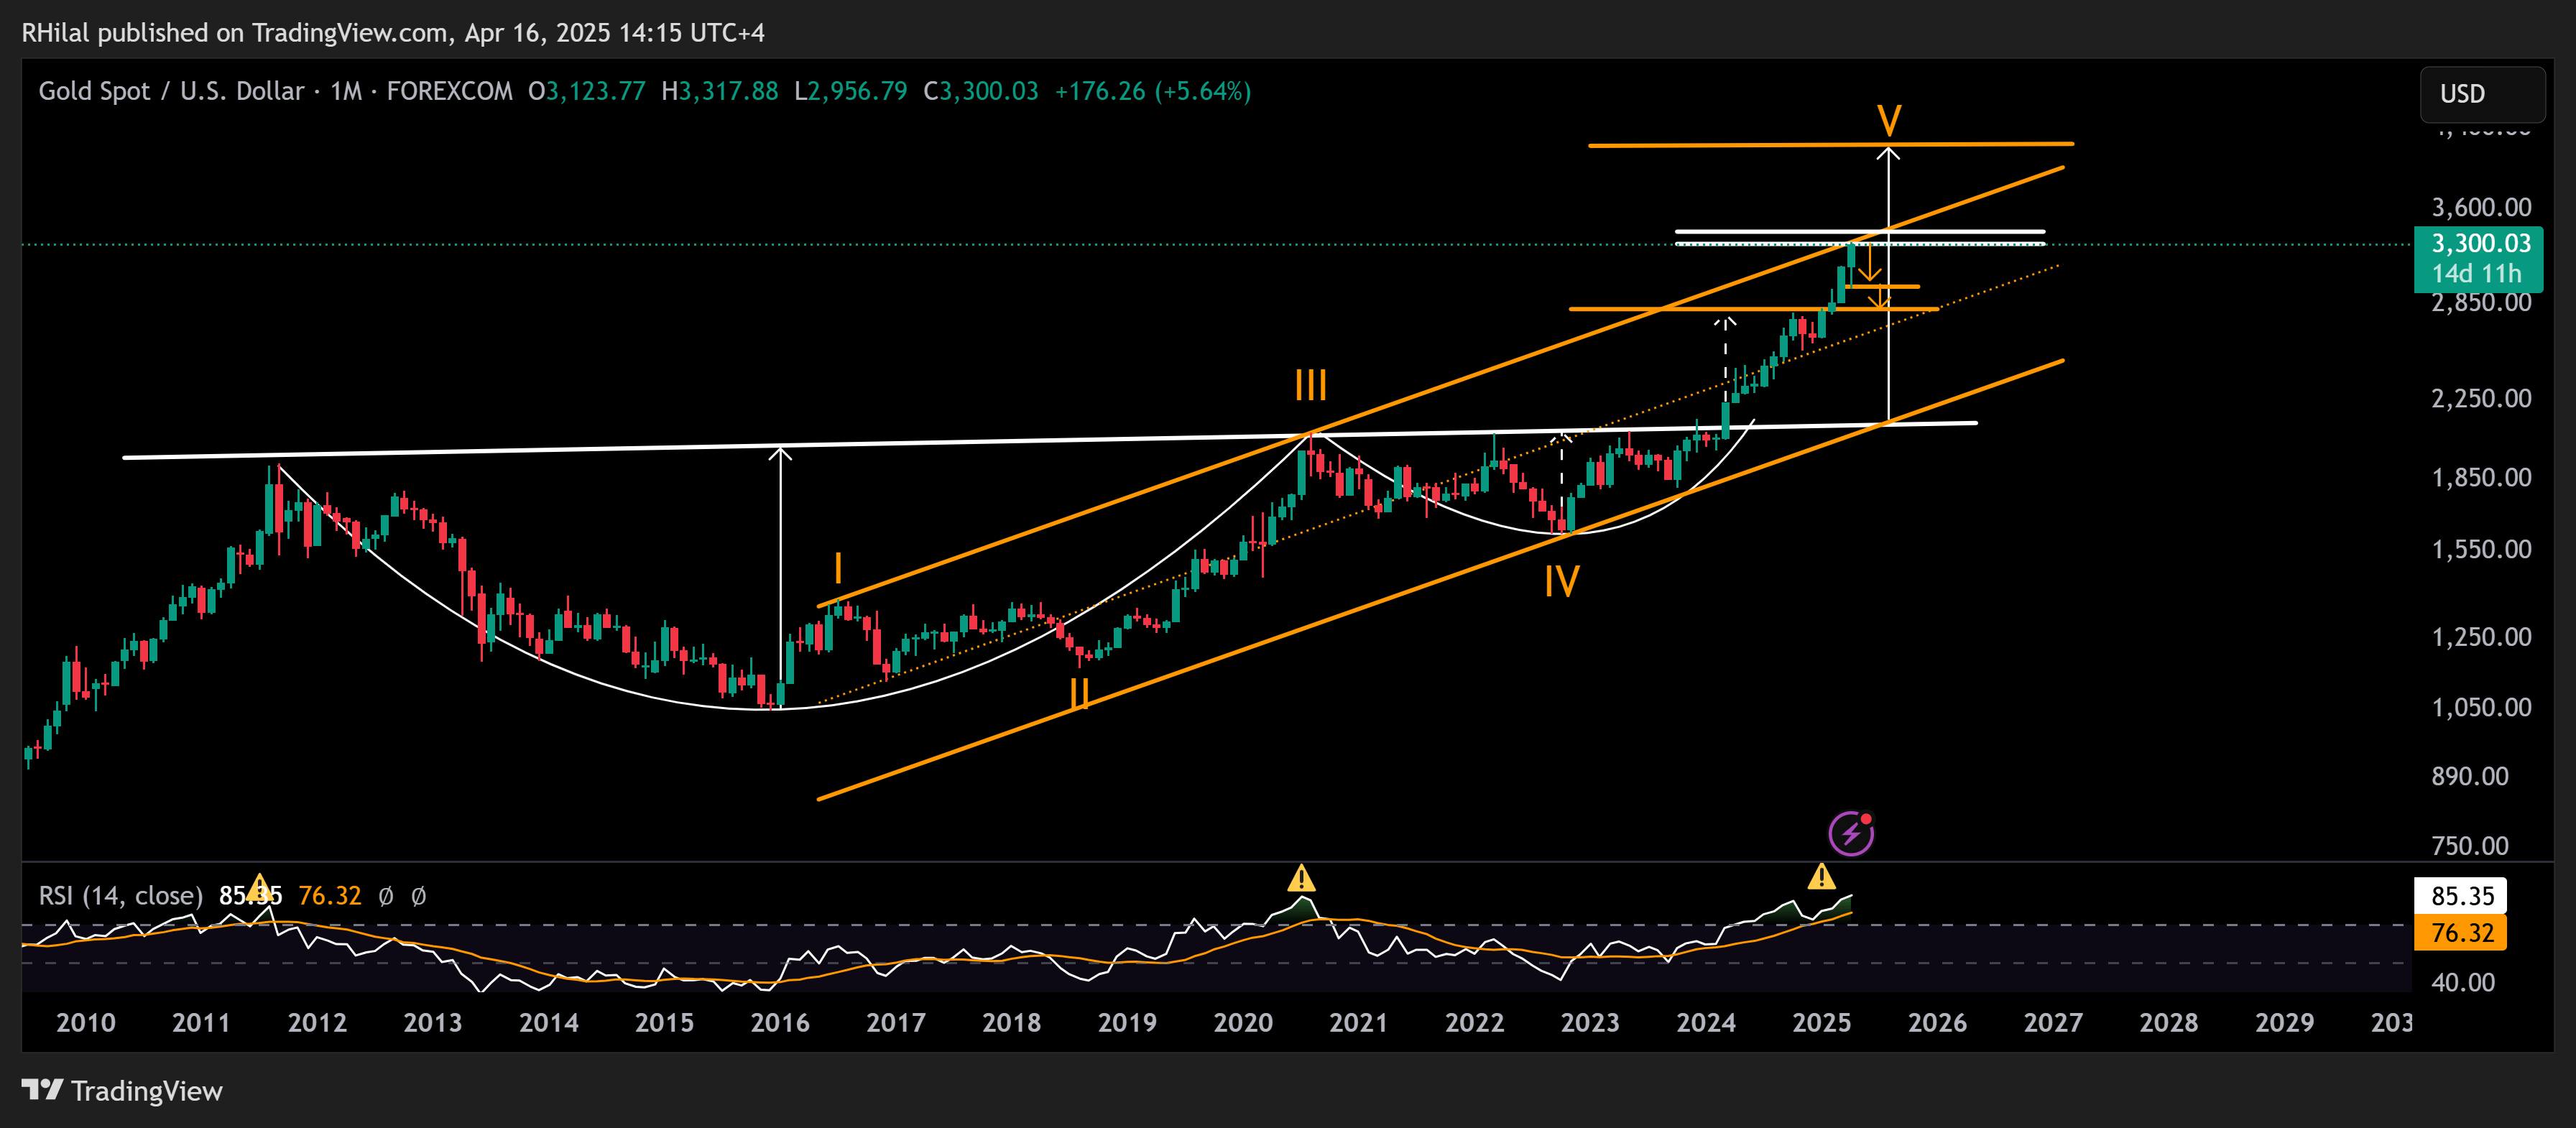
Gold continues its relentless rally, extending record highs above $3,300, fueled by haven demand as risk appetite remains subdued. Despite overbought momentum similar to that seen in 2011 and 2020, the rally persists.
Currently, Gold is approaching a critical resistance trendline, connecting major highs from 2016 to 2020. A sharp reversal could materialize if a trade deal is announced. However, in the absence of a resolution, Gold may continue its climb.
US Dollar Index- Monthly Time Frame – Log Scale
Source: Tradingview
US Dollar Index (DXY): The DXY remains weak, holding between the 98–99 support zone, a key area within a long-standing bullish channel dating back to the 2008 lows.
- A break below 98 could trigger a deeper decline toward the lower boundary of this channel.
- Conversely, a rebound above 100 remains possible—but would require a strong U.S. economic report to be sustained.
From the opposite end we have the EURUSD:
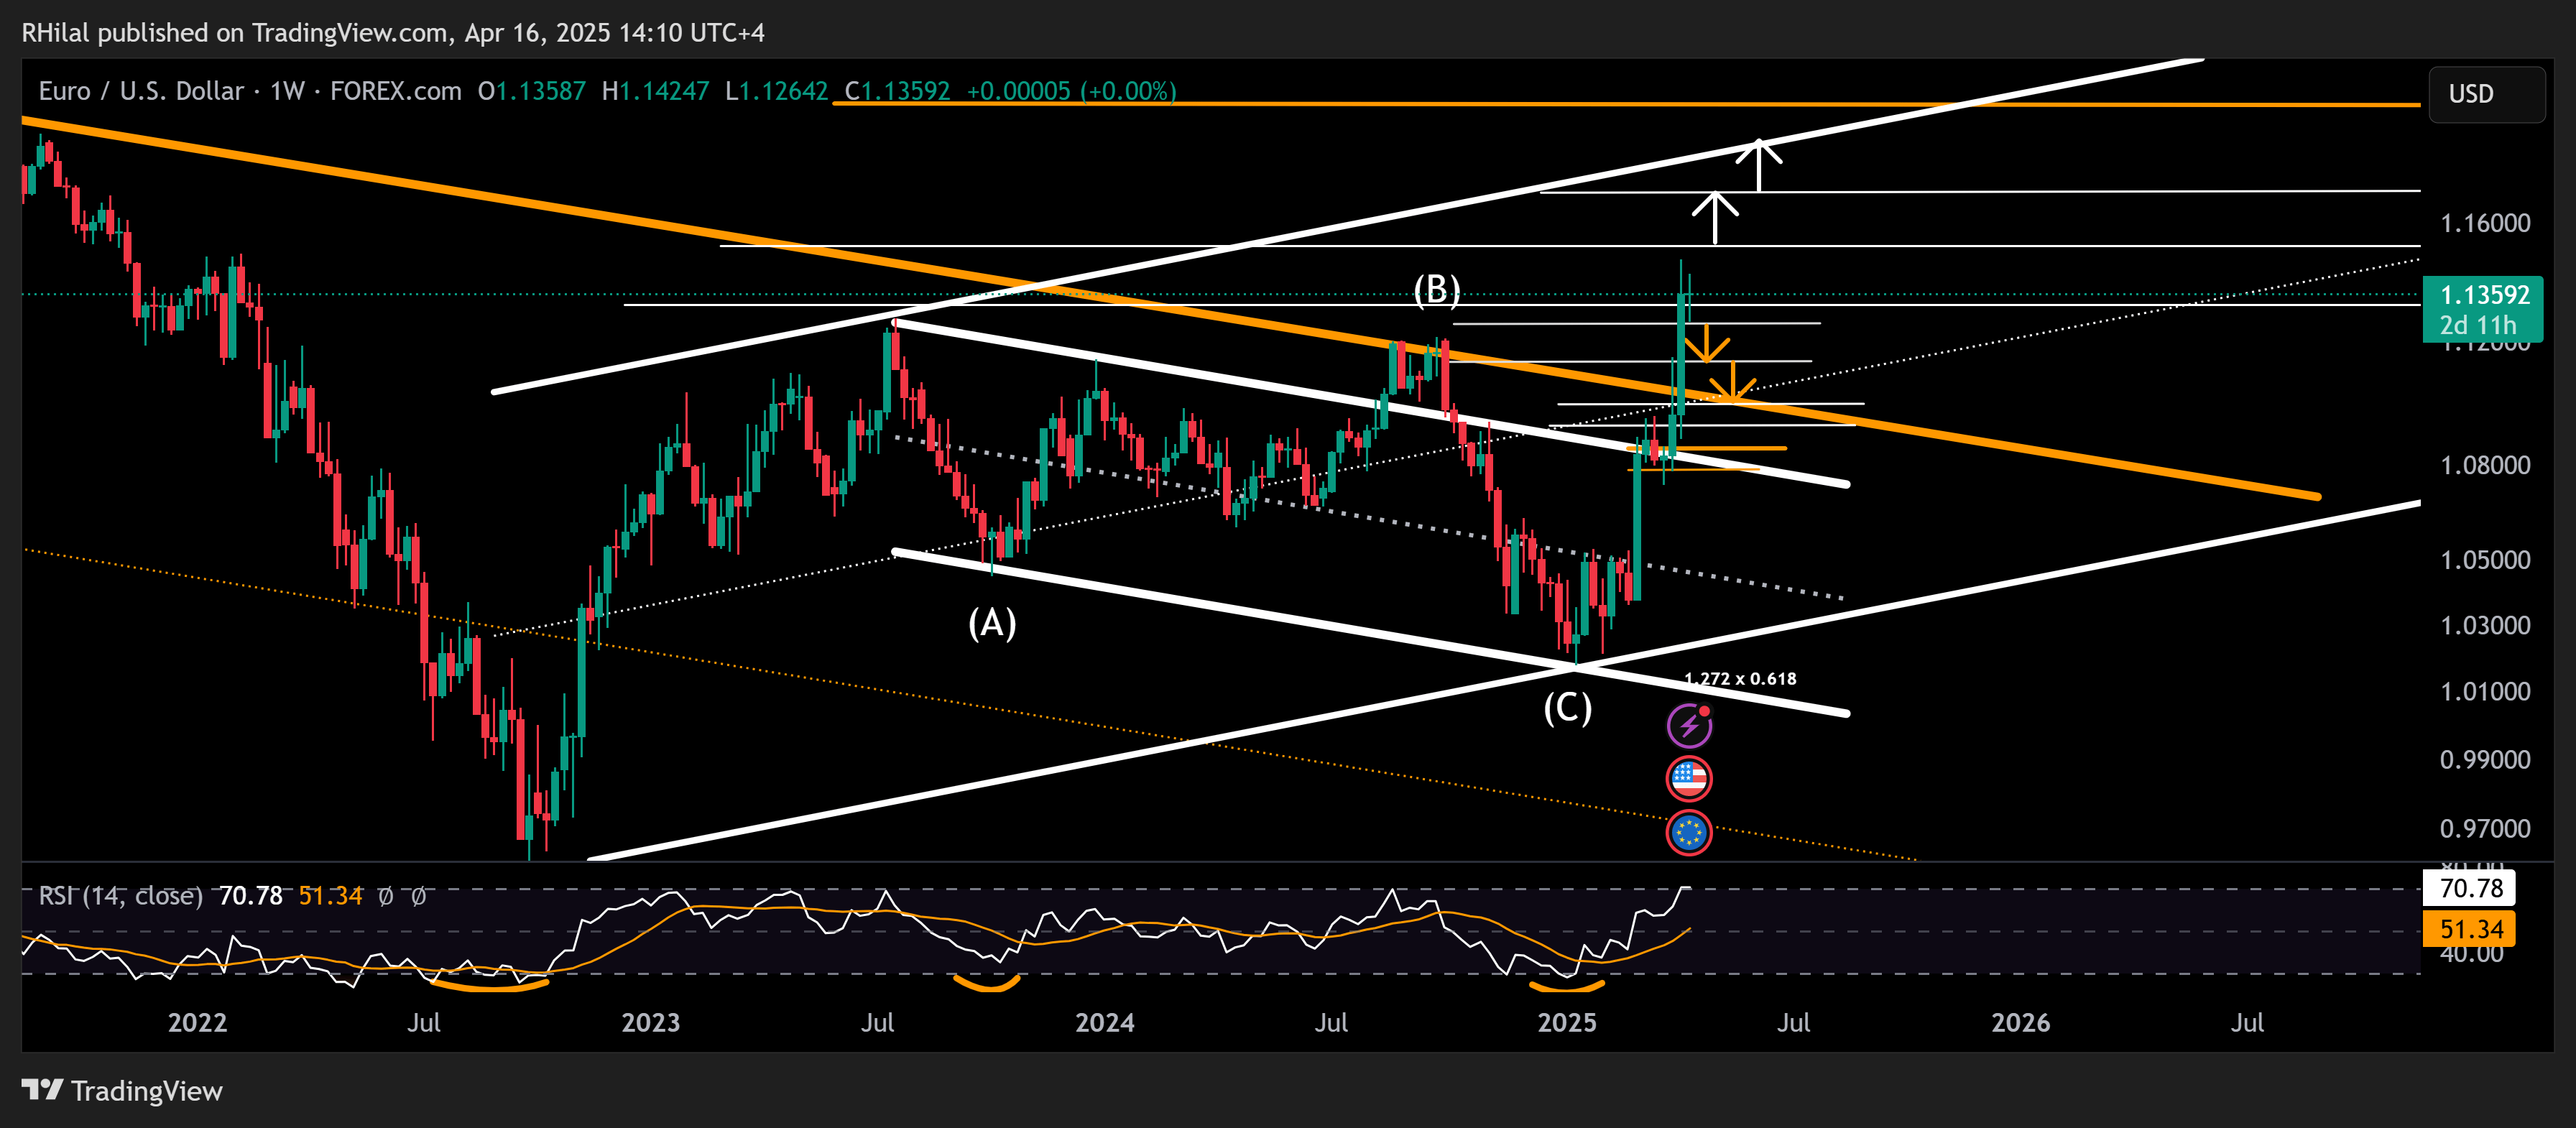
EURUSD - Weekly Time Frame – Log Scale
Source: Tradingview
While the dollar lingers at 3-year lows, the euro is testing 3-year highs, facing critical resistance at 1.15. A confirmed breakout above 1.1520 may open the path to 1.17 and 1.1980, revisiting the 2021 highs.
If the euro pulls back, support levels to watch are: 1.1270, 1.1140, 1.10, and 1.0920, especially if overbought momentum fades—last seen at these levels in 2020.
Gold Forecast: Monthly Time Frame – Log Scale
Source: Tradingview
Despite overbought monthly momentum, Gold continues to climb, supported by haven demand.
- The metal is currently testing a key resistance trendline connecting the 2016–2020 highs, around $3,300.
- A break above $3,330–$3,350 would put Gold on course toward $3,400 and higher
- On the downside, if momentum stalls, key support levels include $3,290, $3,250, $3,220, and $3,200
- A meaningful reversal would likely require progress in peace or trade negotiations to shift sentiment away from risk aversion
Written by Razan Hilal, CMT
Follow on X: @RH_waves


Open an account in minutes
Experience award-winning platforms with fast and secure execution, and enjoy tight spreads from 0.5 pts on FX and 0.3 pts on indices.
Economic calendar
Web Trader platform
Our sophisticated web-based platform is packed with features.
Related articles
Gold Breaks Down on Descending Triangle, Sets Up $4k Test
Gold started last week with a strong sell-off but from that move a bounce developed. Bulls could not hold on through the weekly close, however, and the bearish structure remains in-place for XAU/USD.

Gold Update: XAU/USD Remains Under Pressure Even After the NFP Report
As the trading week comes to an end, weakness around gold price action remains evident in the short term. This can be seen in the performance of the past two sessions, where the metal has declined by approximately 0.3%. Although the move has not been particularly aggressive, it highlights that buying pressure continues to struggle to regain control of the market.


USD Sets Fresh Yearly High as EUR/USD Drops Dramatically, USD/JPY Stable
Well, it was a week of USD strength that wasn’t entirely pushed by USD/JPY, as a strong sell-off in EUR/USD has pushed the major pair to its most oversold state in a decade.
This report is intended for general circulation only. It should not be construed as a recommendation, or an offer (or solicitation of an offer) to buy or sell any financial products. The information provided does not take into account your specific investment objectives, financial situation or particular needs. Before you act on any recommendation that may be contained in this report, independent advice ought to be sought from a financial adviser regarding the suitability of the investment product, taking into account your specific investment objectives, financial situation or particular needs.
StoneX Financial Pte. Ltd., may distribute reports produced by its respective foreign entities or affiliates within the StoneX group of companies or third parties pursuant to an arrangement under Regulation 32C of the Financial Advisers Regulations. Where the report is distributed to a person in Singapore who is not an accredited investor, expert investor or an institutional investor (as defined in the Securities Futures Act), StoneX Financial Pte. Ltd. accepts legal responsibility to such persons for the contents of the report only to the extent required by law. Singapore recipients should contact StoneX Financial Pte. Ltd. at 6826 9988 for matters arising from, or in connection with the report.
In the case of all other recipients of this report, to the extent permitted by applicable laws and regulations neither StoneX Financial Pte. Ltd. nor its associated companies will be responsible or liable for any loss or damage incurred arising out of, or in connection with, any use of the information contained in this report and all such liability is hereby expressly disclaimed. No representation or warranty is made, express or implied, that the content of this report is complete or accurate.
StoneX Financial Pte. Ltd. is not under any obligation to update this report.
Trading CFDs carries a high level of risk that may not be suitable for some investors. Consider your investment objectives, level of experience, financial resources, risk appetite and other relevant circumstances carefully. The possibility exists that you could lose some or all of your investments, including your initial deposits. If in doubt, please seek independent expert advice. Visit www.forex.com/en-sg/terms-and-policies for the complete Risk Disclosure Statement.