



Equities Weekly Outlook: PepsiCo, Delta Airlines & Constellation Brands
Earnings this week come from PepsiCo, Delta Airlines & Constellation Brands.
Share this:

PepsiCo Fiscal Q3 Earnings Preview
PepsiCo, the global food and beverage giant, will release fiscal Q3 results ahead of the market open on October 8. Expectations are for EPS of $2.30, up marginally from $2.29 in the same quarter a year earlier. Revenue is expected at $24.97 billion, up from $23.94 billion in Q3 of the previous year.
The results come as PepsiCo's performance has lost some fizz over the past year, owing to weaker consumer demand and sluggish sales growth.
Softness is showing up across PepsiCo's core businesses. In the second quarter, PepsiCo North America saw organic sales decline 2% year on year, while PepsiCo Beverages North America managed just 1% growth. Both businesses came in below expectations, highlighting the challenges PepsiCo faces in reigniting demand across its huge snack and beverage portfolio.
The analyst view is cautiously optimistic, with a moderate Buy overall rating. Of the 23 analysts covering the stock, six recommend a Strong Buy, 16 suggest Hold and one has a Strong Sell rating.
How to Trade PEP Earnings
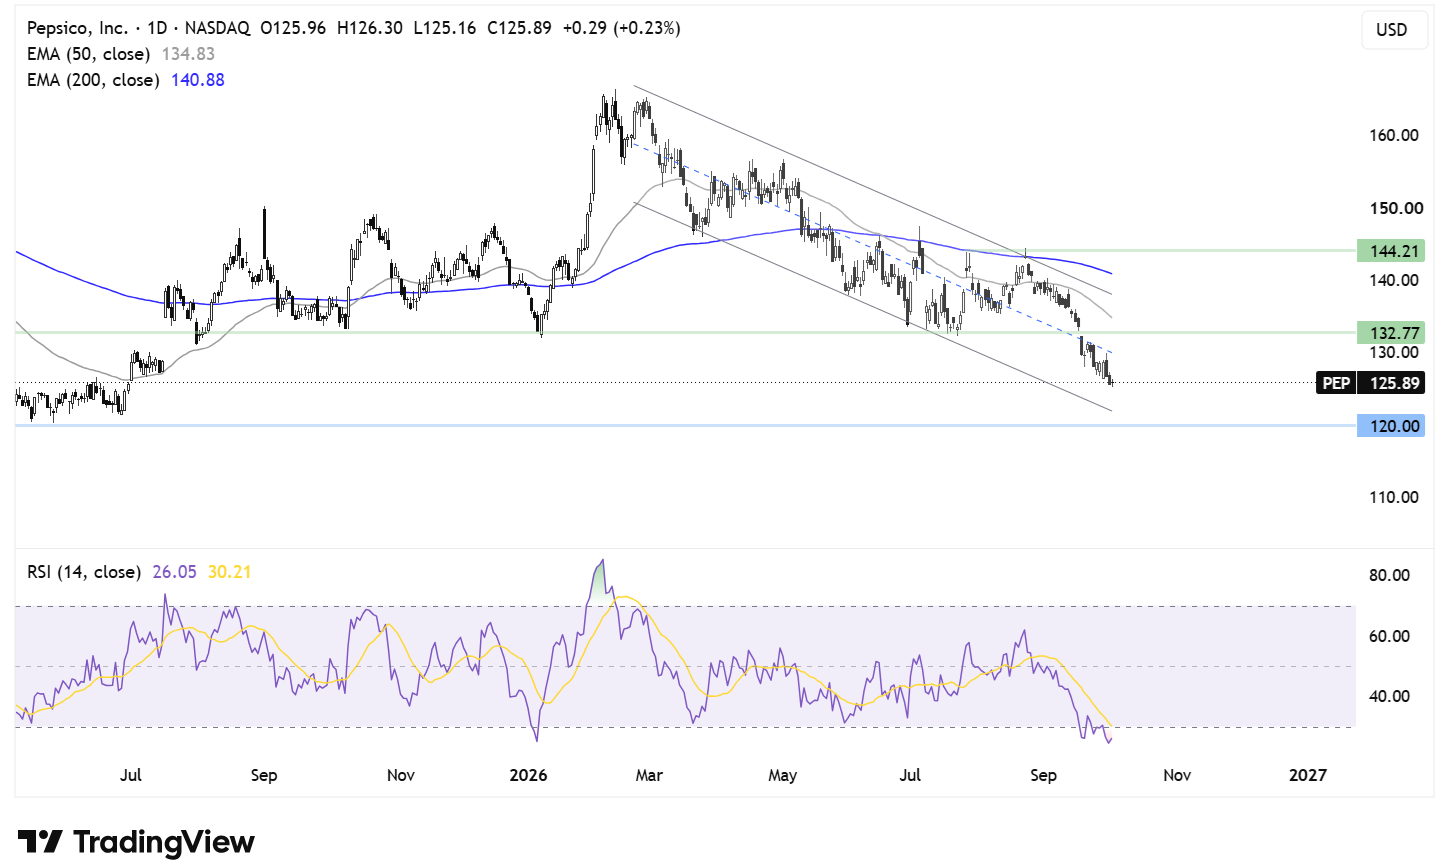
PepsiCo trades in a descending channel dating back to the start of the year. The price also trades below its 50 and 200 EMAs, falling to a low of $125, a level last seen in May 2025. The RSI is oversold, so a period of consolidation or a move higher could be on the cards.
On the downside, sellers will look towards $121, the lower band of the falling channel. A break below here brings $120 into focus.
Any recovery would first need to rise above $132.50, the July low, and the January low. Above here, attention turns to the 50 EMA at $135, followed by the falling trend line and the upper band of the falling channel around $139. The 200 EMA at $141 is the next major resistance. A break above here could give buyers greater traction.
Delta Air Lines Q3 Earnings Preview
Delta Air Lines will report Q3 earnings on October 9 before the market opens.
Expectations are for EPS of around $1.88–$2.03 and revenue of $17.62 billion, representing around 6% annual growth/decline depending on the underlying consensus measure.
The company's second-quarter performance was stronger than expected, with EPS of $1.56 versus $1.53 expected, while adjusted revenue was $17.7 billion, up 14% year on year.
In the third quarter, the market will focus closely on:
- Domestic and international route demand
- Corporate and premium passenger revenue
- Ticket prices
- Unit costs
With global oil prices remaining elevated, jet fuel costs have re-emerged as a key variable. The market will be watching closely to see whether higher oil prices have eroded Q3 margins and whether the company can mitigate the impact of fuel-price volatility through higher pricing.
If travel demand remains strong and the company maintains its full-year earnings guidance of EPS of $6.50–$7.50 and free cash flow of $3 billion–$4 billion, it would indicate that U.S. consumer spending on services remains resilient. However, if fuel costs rise rapidly or booking demand weakens, earnings expectations could be revised lower.
How to Trade DAL Earnings
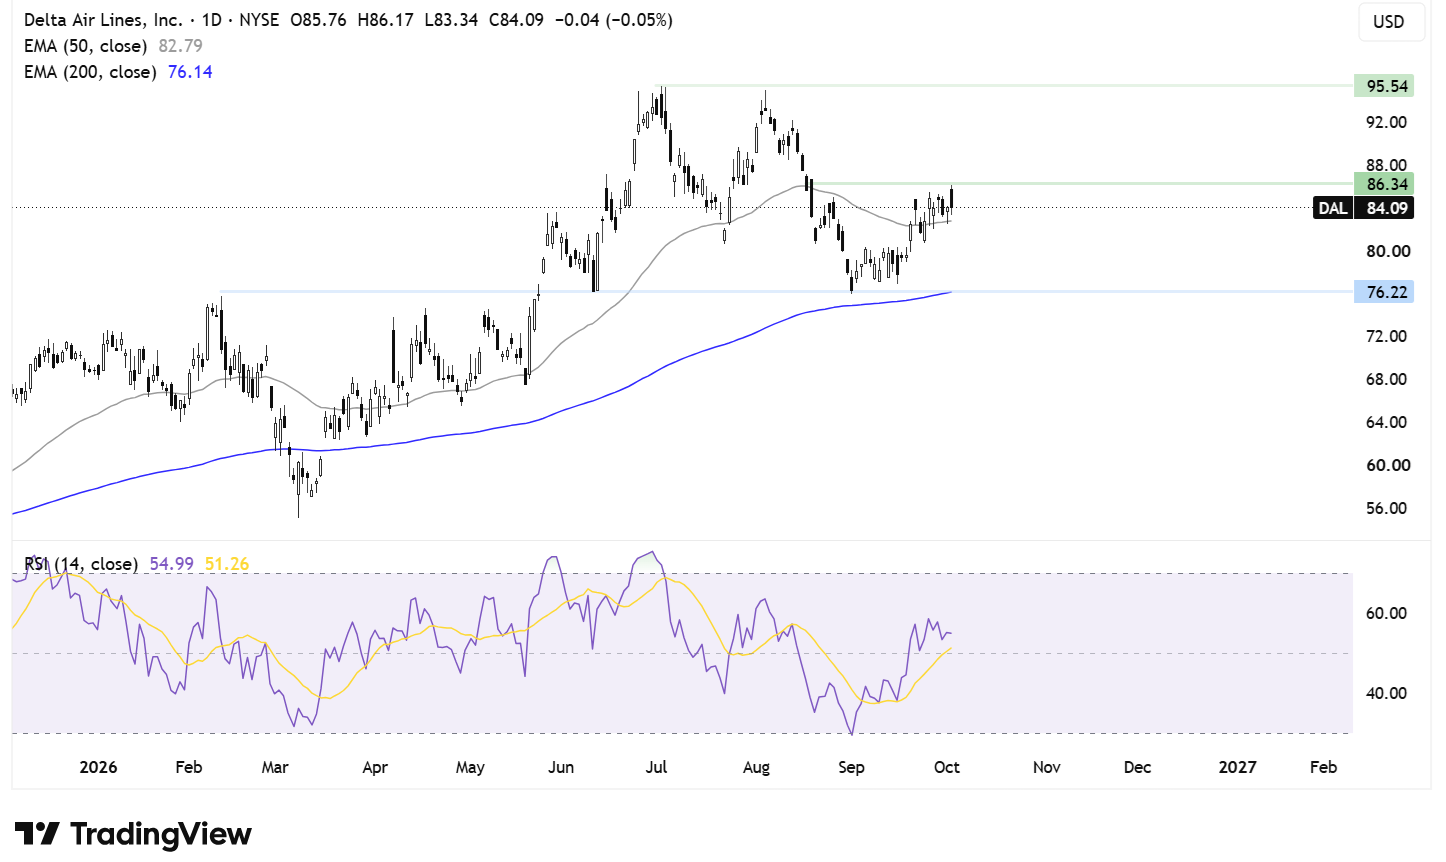
After forming a double top around $95, the price moved lower, finding support at $76, around the June low and February high. From there, the stock rebounded, reclaiming the 50 EMA and now trading above both its 50 and 200 EMAs, creating a constructive technical outlook.
Buyers will look to rise above $86, the October high, which would bring $95 back into focus. A break above $95 would create a higher high and turn attention towards $100.
On the downside, immediate support is seen at the 50 EMA around $82–$83. A break below here would turn attention towards $76, where the 200 EMA and August low provide further support.
Constellation Brands Fiscal Q2 Earnings Preview
Constellation Brands will release fiscal Q2 earnings on October 6 ahead of the market open. Expectations are for EPS of $3.62 on revenue of $2.57 billion, pointing to around 3.6% year-on-year growth.
For fiscal Q1, Constellation Brands reported revenue of $2.43 billion, down 3.3% from the prior year, while EPS came in at $3.79 compared with $2.89 in the prior quarter.
The earnings come as the share price trades at a yearly low.
Recent underperformance has come amid pressure from tariffs on aluminium cans and softer U.S. alcohol consumption, affecting profit margins and future earnings expectations.
Constellation Brands' earnings remain closely tied to the health of the U.S. consumer. Persistent inflation, higher living costs and elevated interest rates are putting pressure on disposable incomes and encouraging consumers to trade down, which could weigh on demand for its premium beer brands.
At the same time, tariffs and higher input costs, particularly across its Mexico-U.S. supply chain, present a risk to margins. However, strong brands such as Modelo, Corona and Pacifico continue to support pricing power and market-share gains, helping to offset some of the broader macroeconomic headwinds.
How to Trade STZ Earnings
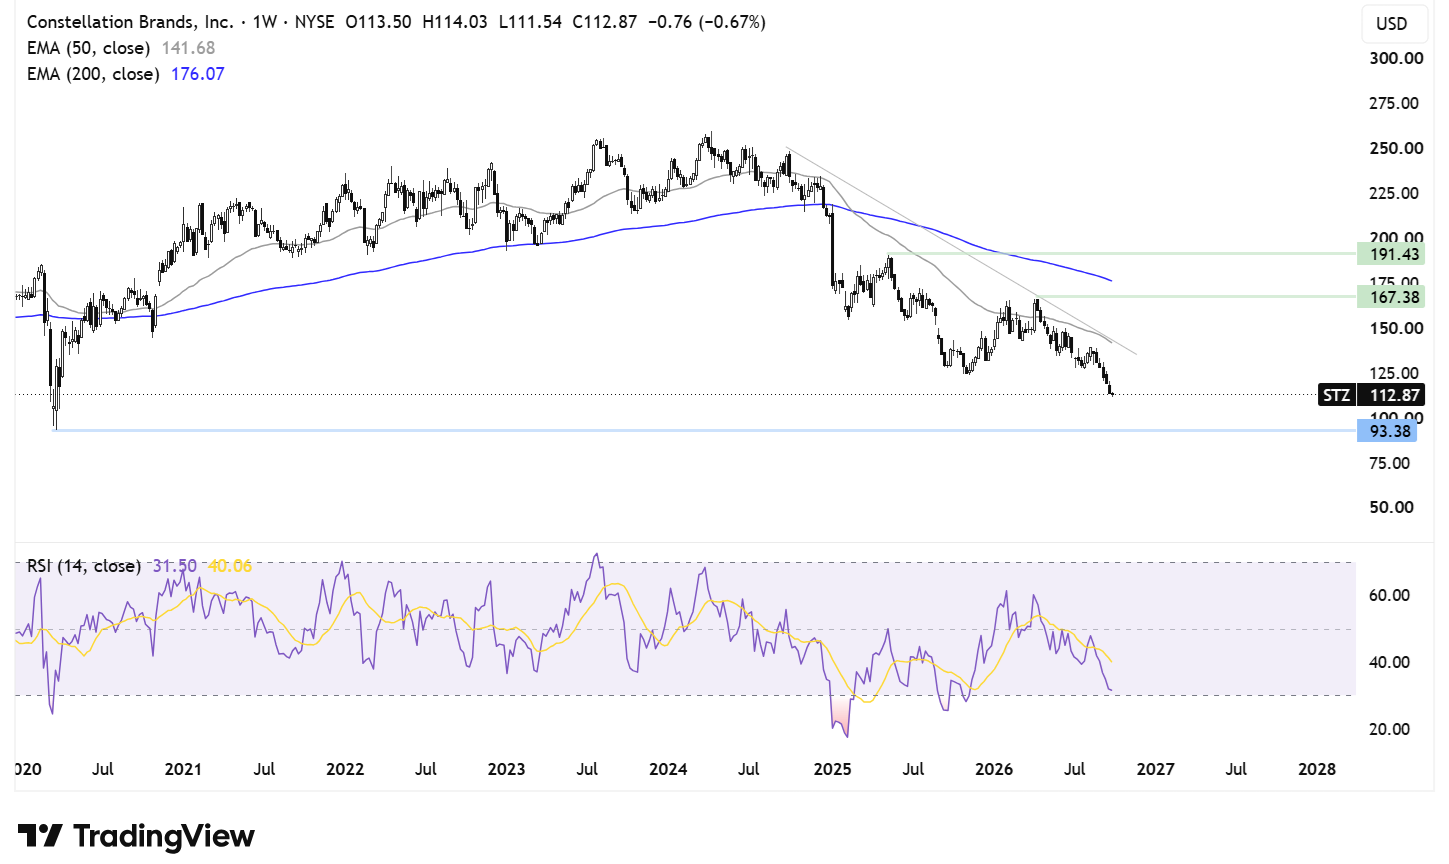
Constellation Brands has been forming a series of lower lows and lower highs on the weekly chart. The price trades below its falling trend line, 50 EMA and 200 EMA, creating a bearish technical picture. The stock is around $112, a level last seen in March 2020.
Sellers, supported by bearish momentum, will look to extend the decline towards the March 2020 low of $93.
On the upside, any recovery would first need to retake $143, where the 50 EMA and falling trend-line resistance converge. A break above here brings $165 into focus, the April high, and exposes the 200 EMA at $176.
Above here, attention turns to $186, the May 2025 high.
Related tags:



Open an account in minutes
Experience award-winning platforms with fast and secure execution, and enjoy tight spreads from 0.5 pts on FX and 0.3 pts on indices.
Economic calendar
Web Trader platform
Our sophisticated web-based platform is packed with features.
Related articles

Equities Weekly Outlook: PepsiCo, Delta Airlines & Constellation Brands
Earnings this week come from PepsiCo, Delta Airlines & Constellation Brands.

S&P 500, Nasdaq, Dow Forecast: Wall Street Split Widens Into Month-End 9 26 2026
Nasdaq strength contrasts with mounting Dow pressure as rising Treasury yields raise the stakes for stocks heading into the monthly close.


Weekly Equities Outlook: Nike, Micron Technology, Carnival Corp.
Earnings from Nike comes as the share price trades at a 12-year low. Micron Technology keeps the AI trade in focus and Carnival suffers from rising fuel costs.
This report is intended for general circulation only. It should not be construed as a recommendation, or an offer (or solicitation of an offer) to buy or sell any financial products. The information provided does not take into account your specific investment objectives, financial situation or particular needs. Before you act on any recommendation that may be contained in this report, independent advice ought to be sought from a financial adviser regarding the suitability of the investment product, taking into account your specific investment objectives, financial situation or particular needs.
StoneX Financial Pte. Ltd., may distribute reports produced by its respective foreign entities or affiliates within the StoneX group of companies or third parties pursuant to an arrangement under Regulation 32C of the Financial Advisers Regulations. Where the report is distributed to a person in Singapore who is not an accredited investor, expert investor or an institutional investor (as defined in the Securities Futures Act), StoneX Financial Pte. Ltd. accepts legal responsibility to such persons for the contents of the report only to the extent required by law. Singapore recipients should contact StoneX Financial Pte. Ltd. at 6826 9988 for matters arising from, or in connection with the report.
In the case of all other recipients of this report, to the extent permitted by applicable laws and regulations neither StoneX Financial Pte. Ltd. nor its associated companies will be responsible or liable for any loss or damage incurred arising out of, or in connection with, any use of the information contained in this report and all such liability is hereby expressly disclaimed. No representation or warranty is made, express or implied, that the content of this report is complete or accurate.
StoneX Financial Pte. Ltd. is not under any obligation to update this report.
Trading CFDs carries a high level of risk that may not be suitable for some investors. Consider your investment objectives, level of experience, financial resources, risk appetite and other relevant circumstances carefully. The possibility exists that you could lose some or all of your investments, including your initial deposits. If in doubt, please seek independent expert advice. Visit www.forex.com/en-sg/terms-and-policies for the complete Risk Disclosure Statement.