


EUR/USD breakout shifts focus to payrolls, peace deals
Markets have pared back Fed tightening expectations, energy prices have fallen and the US dollar has been knocked off balance by the intervention episode in Japan. Together they've helped EUR/USD break higher, but can it last?
Share this:

- EUR/USD breaks long-running downtrend resistance
- Fed rate hike pricing pares back to 42bp by June 2027
- Lower energy prices improve euro area outlook
- Payrolls, peace negotiations to determine whether breakout has legs
EUR/USD has broken higher after spending much of this year trapped beneath downtrend resistance. Whether it sinks or swims will likely be determined by the incoming flow of US economic data and developments in the Gulf.
The stars align... for now
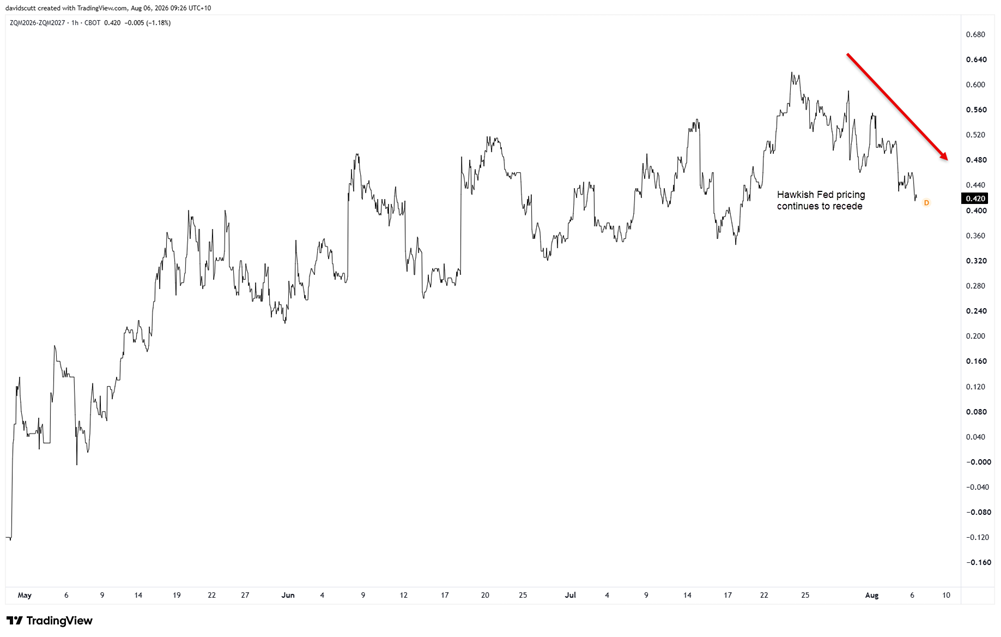
One of the key factors that's changed over the past week has been the US rate outlook. While the latest US data has generally continued to point to an economy that's performing strongly, traders have become less convinced about how much the Fed will need to tighten in order to combat inflation.
Both the ISM manufacturing and services PMIs outperformed expectations, while strength in the new orders components of both surveys points to the US economy continuing to chug along into the second half of the year.
Despite that, markets have pared back the amount of tightening priced by the June Fed meeting next year to around 42 basis points. Correlation analysis suggests EUR/USD has been tracking shifts in front-end US rates closely over the past week, helping to explain some of the move higher.
Source: TradingView
The other factor that's worked in the euro's favour has been the optimism that we'll eventually see some form of lasting peace deal in the Middle East. Whether that eventuates remains highly uncertain, but markets have responded by pushing energy prices lower once again.
That's important because Europe is a major net energy importer. Compared with the United States, which enjoys far greater energy security as the world's largest producer, lower oil and gas prices are a much bigger positive for the euro area economy. They reduce one of the key headwinds that has weighed on the common currency in recent months, easing the need for the ECB to respond aggressively to a supply-driven inflation shock that would otherwise have amplified the downside risks to economic activity.
Another factor that's probably helped the euro has been the intervention episode in Japan. It's highly unusual to see the US Treasury get involved in supporting another currency when we're not talking about a financial crisis or disorderly market conditions.
Why the US decided to get involved remains unclear. Whether it was about the yen, foreign demand for Treasuries, US FX competitiveness, or something else entirely, we simply don't know. What we do know is that it's put the US dollar on the back foot, providing a near-term tailwind for EUR/USD.
Clearly, the positives that have helped the euro not only come across as being very short-term factors, but there's also a lot of uncertainty as to whether they'll stick.
From a directional perspective for the euro, a lot of it will come down to the Gulf and Friday's US payrolls report, which really looms as the key factor given its ability to shift the Fed rate outlook.
EUR/USD breakout shifts focus higher
Source: TradingView
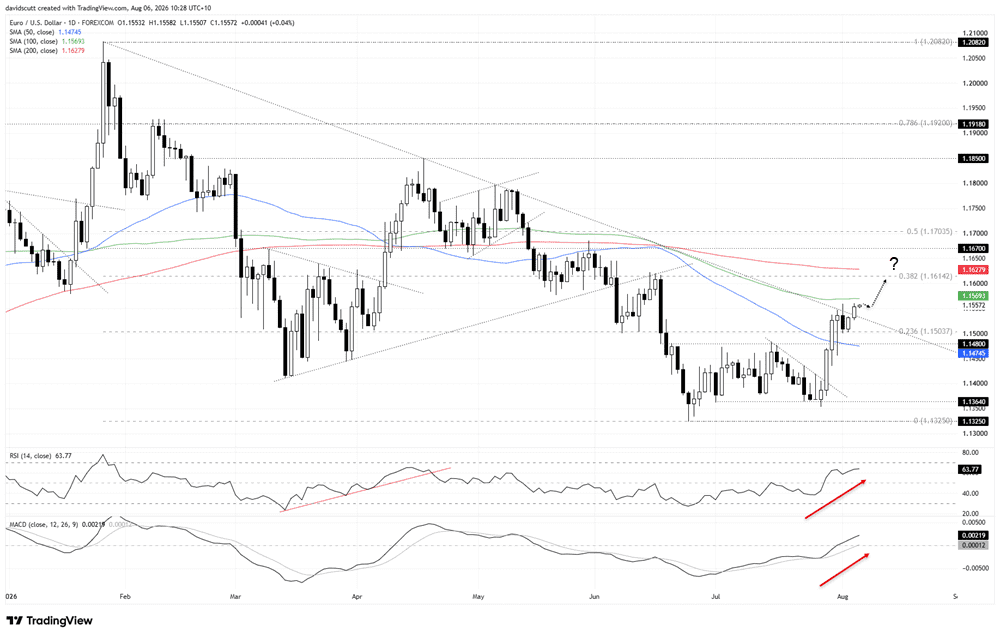
Turning to the charts, we saw a breakout from the minor downtrend that had been in place from the highs set back in the middle of July following last week's Fed meeting. That has since seen the pair extend the move, breaking above resistance at 1.1480 and the 50-day moving average to test the long-running downtrend that's been in place since late January.
After one false break on Monday that saw the pair retrace to the 23.6% Fibonacci retracement of the January to June bear move, we're now seeing a bounce and a close above that downtrend, creating the potential for a run higher.
1.1550 is an important level in the near term, marking where the pair stalled on Monday. If we manage to hold above that level, it opens the door to a test of the 100-day moving average. It has a much more chequered history in terms of influencing price action than the 50- and 200-day moving averages, but a push beyond it would put the 38.2% Fibonacci retracement of the January to June bear move, and more importantly, the 200-day moving average, into focus.
A break above the latter would be significant given the way price has interacted with it in the past, creating the potential for a much larger bullish move.
Of course, if the pair fails to build on the breakout and retraces back beneath the trendline, it would add to the sense that bears remain in the ascendency. That would bring the 23.6% Fibonacci retracement of the January to June bear move, along with the confluence of former resistance at 1.1480 and the 50-day moving average, back into play. A break beneath that zone would point to a much larger unwind towards the July lows.
The oscillators favour the breakout sticking. RSI (14) continues to set higher lows and higher highs while moving further away from the neutral 50 level, but is not yet overbought. That message is confirmed by MACD, which has flipped positive and continues to diverge further away from the signal line, building upside momentum. It's not a screaming buy signal by any stretch, but it does favour buying dips and bullish breakouts rather than trying to play it from the short side in the near term.
Related tags:


Open an account in minutes
Experience award-winning platforms with fast and secure execution, and enjoy tight spreads from 0.5 pts on FX and 0.3 pts on indices.
Economic calendar
Web Trader platform
Our sophisticated web-based platform is packed with features.
Related articles
USD/CAD shooting star puts September surge on notice
USD/CAD has printed a clear bearish reversal pattern after an extraordinary September surge, but confirmation may depend heavily on how US Treasury yields react to Friday’s payrolls report.

USD/CHF Reverses as Swiss Franc Surges amid Bond Carnage
USD/CHF reverses from channel resistance as bond volatility surges and broad Swiss franc strength points to a possible carry-trade unwind.


USD/MXN Analysis: Is Super Peso Starting to Fade?
Over recent trading sessions, the Mexican peso has continued to show signs of weakness against the U.S. dollar. This can already be seen in USD/MXN, which has gained more than 1.7% over the last three sessions, highlighting sustained buying pressure in favor of the dollar in the short term.

This report is intended for general circulation only. It should not be construed as a recommendation, or an offer (or solicitation of an offer) to buy or sell any financial products. The information provided does not take into account your specific investment objectives, financial situation or particular needs. Before you act on any recommendation that may be contained in this report, independent advice ought to be sought from a financial adviser regarding the suitability of the investment product, taking into account your specific investment objectives, financial situation or particular needs.
StoneX Financial Pte. Ltd., may distribute reports produced by its respective foreign entities or affiliates within the StoneX group of companies or third parties pursuant to an arrangement under Regulation 32C of the Financial Advisers Regulations. Where the report is distributed to a person in Singapore who is not an accredited investor, expert investor or an institutional investor (as defined in the Securities Futures Act), StoneX Financial Pte. Ltd. accepts legal responsibility to such persons for the contents of the report only to the extent required by law. Singapore recipients should contact StoneX Financial Pte. Ltd. at 6826 9988 for matters arising from, or in connection with the report.
In the case of all other recipients of this report, to the extent permitted by applicable laws and regulations neither StoneX Financial Pte. Ltd. nor its associated companies will be responsible or liable for any loss or damage incurred arising out of, or in connection with, any use of the information contained in this report and all such liability is hereby expressly disclaimed. No representation or warranty is made, express or implied, that the content of this report is complete or accurate.
StoneX Financial Pte. Ltd. is not under any obligation to update this report.
Trading CFDs carries a high level of risk that may not be suitable for some investors. Consider your investment objectives, level of experience, financial resources, risk appetite and other relevant circumstances carefully. The possibility exists that you could lose some or all of your investments, including your initial deposits. If in doubt, please seek independent expert advice. Visit www.forex.com/en-sg/terms-and-policies for the complete Risk Disclosure Statement.