


EUR/USD, Oil Forecast: Two trades to watch
EUR/USD rises, but the bearish outlook remains. Oil falls further as hopes of restraint and diplomacy in the Middle East rise.
Share this:

EUR/USD rises, but the bearish outlook remains
EUR/USD is rising towards 1.1160 in early trade on Monday, as a hawkish stance from the ECB adds some support to the euro. However, the longer-term bearish bias remains intact.
Last week, ECB President Christine Lagarde said that the central bank would be looking at indicators for signs that another rate hike is warranted next month, after leaving rates unchanged in October.
The market is pricing in an 80% probability of a 25-basis-point hike. This comes as inflation in the region topped 4% in September amid rising energy prices across October owing to the Middle East conflict.
Still oil fell last week, with Brent down 16% last week. Even so, euro's latest showing has been rather unimpressive. Not even the large U.S. tech sell-off was enough to prompt buying in EUR/USD.
The U.S. dollar came under pressure on Friday after posting gains last week. The greenback was supported by safe-haven flows following the midterm elections and the stronger-than-expected U.S. nonfarm payroll report, which smashed expectations. The U.S. recorded 165,000 jobs added, more than double the 65,000 forecast. The strong data supports the view that the Fed will hike rates again in December.
Attention this week will be on U.S. inflation figures on Tuesday and PPI data on Friday. CPI is expected to rise to 3.9% year-on-year in October, up from 3.7%. However, a 15% rise in oil across October could result in an upside surprise.
In addition to economic data and a calendar full of Fed speakers, attention will also be on the performance of the AI trade. A rotation into Treasuries as safe havens supported the view that we saw a rotation into cash, but not necessarily out of the dollar.
The euro's inability to capitalise on dollar weakness and falling energy prices suggests that markets are not yet convinced by the prospect of further ECB tightening. With the Fed also expected to remain hawkish, the interest-rate differential could continue to limit EUR/USD gains.
EUR/USD forecast – technical analysis
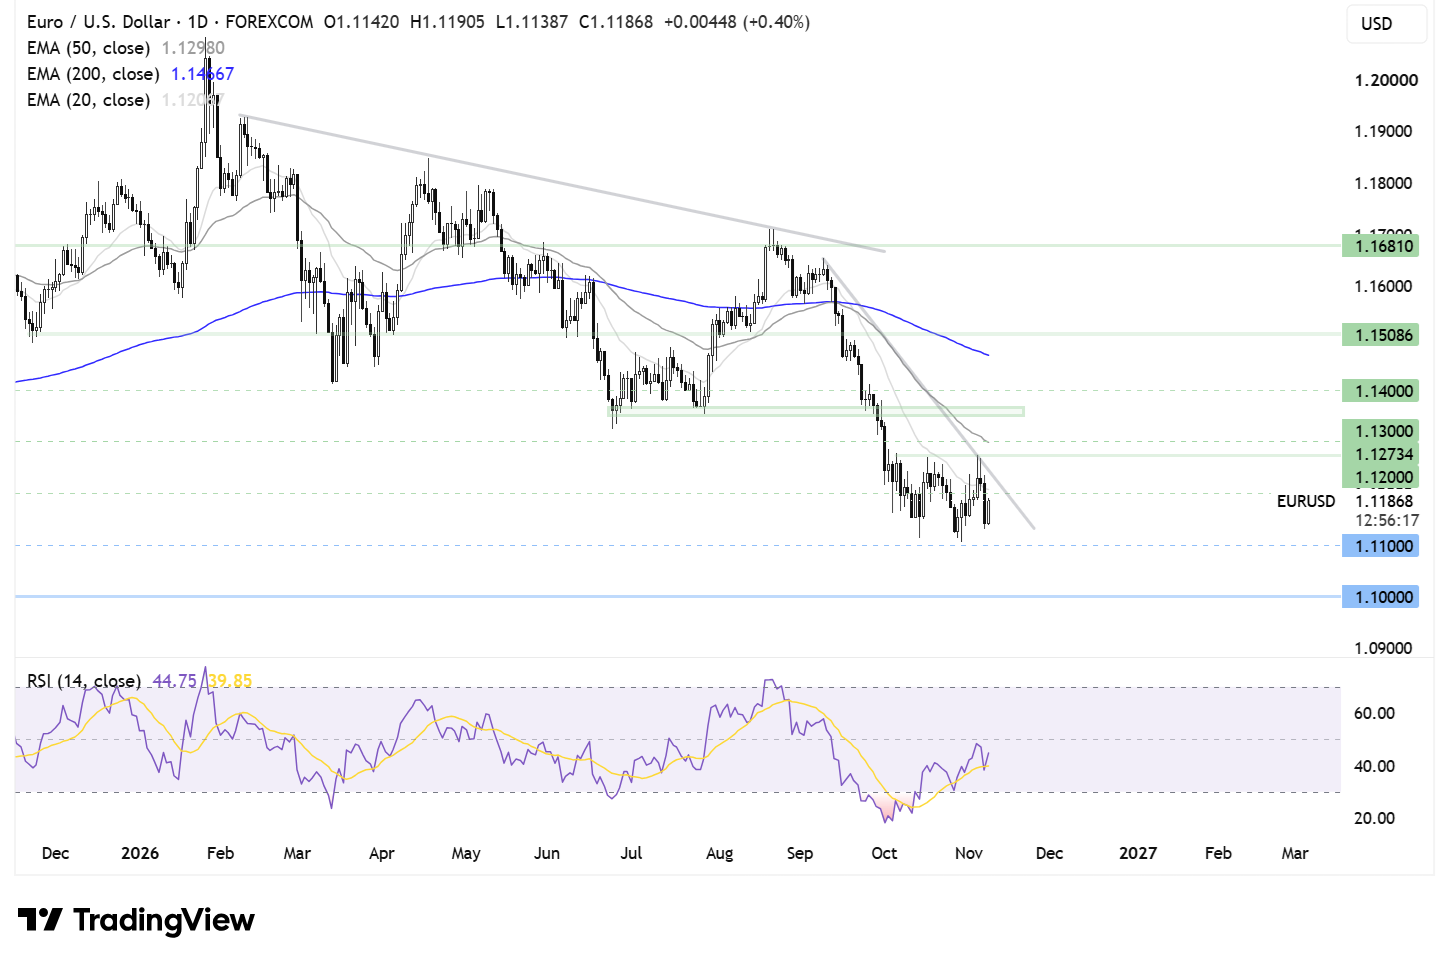
EUR/USD trades below its falling trendline, as well as its 50 and 200 EMAs, keeping the technical picture bearish.
While the price has recovered from the 1.11 lows in late October, gains have been capped by 1.1275.
Buyers would need to retake this level and the 50 EMA at 1.13 in order to turn attention to 1.1375, the July low, and put the price on a firmer footing.
On the downside, sellers need to take out 1.11 to extend the bearish move towards the 1.10 psychological level.
Oil falls further as hopes of restraint and diplomacy in the Middle East rise
Oil prices are under pressure at the start of the new week after slumping sharply last week. This follows President Trump lowering expectations of renewed strikes on Iran, even as attacks continue in the Strait of Hormuz.
Last week, Brent tumbled 16% in its steepest weekly decline since the Covid pandemic, while WTI fell 12%.
The declines came following the midterm elections and the Democrats taking control of Congress, fuelling optimism surrounding de-escalation in the Middle East, even though a comprehensive agreement between Washington and Tehran has yet to materialise.
The market will want to see a diplomatic breakthrough, combined with the normalisation of shipping through the Strait of Hormuz, for prices to fall significantly further.
Trump said on Sunday that he was unlikely to order further attacks on Iran as long as talks to end the conflict progressed.
At the same time, attacks on ships in or near the Strait of Hormuz have continued.
Meanwhile, JP Morgan warned that oil is heading for a glut as recovering flows from the Middle East, calmer seas and weak demand have pushed global supply above consumption. The investment bank estimates a surplus of 1.1 million barrels a day in September, widening to 1.4 million barrels a day in October.
Oil forecast – technical analysis
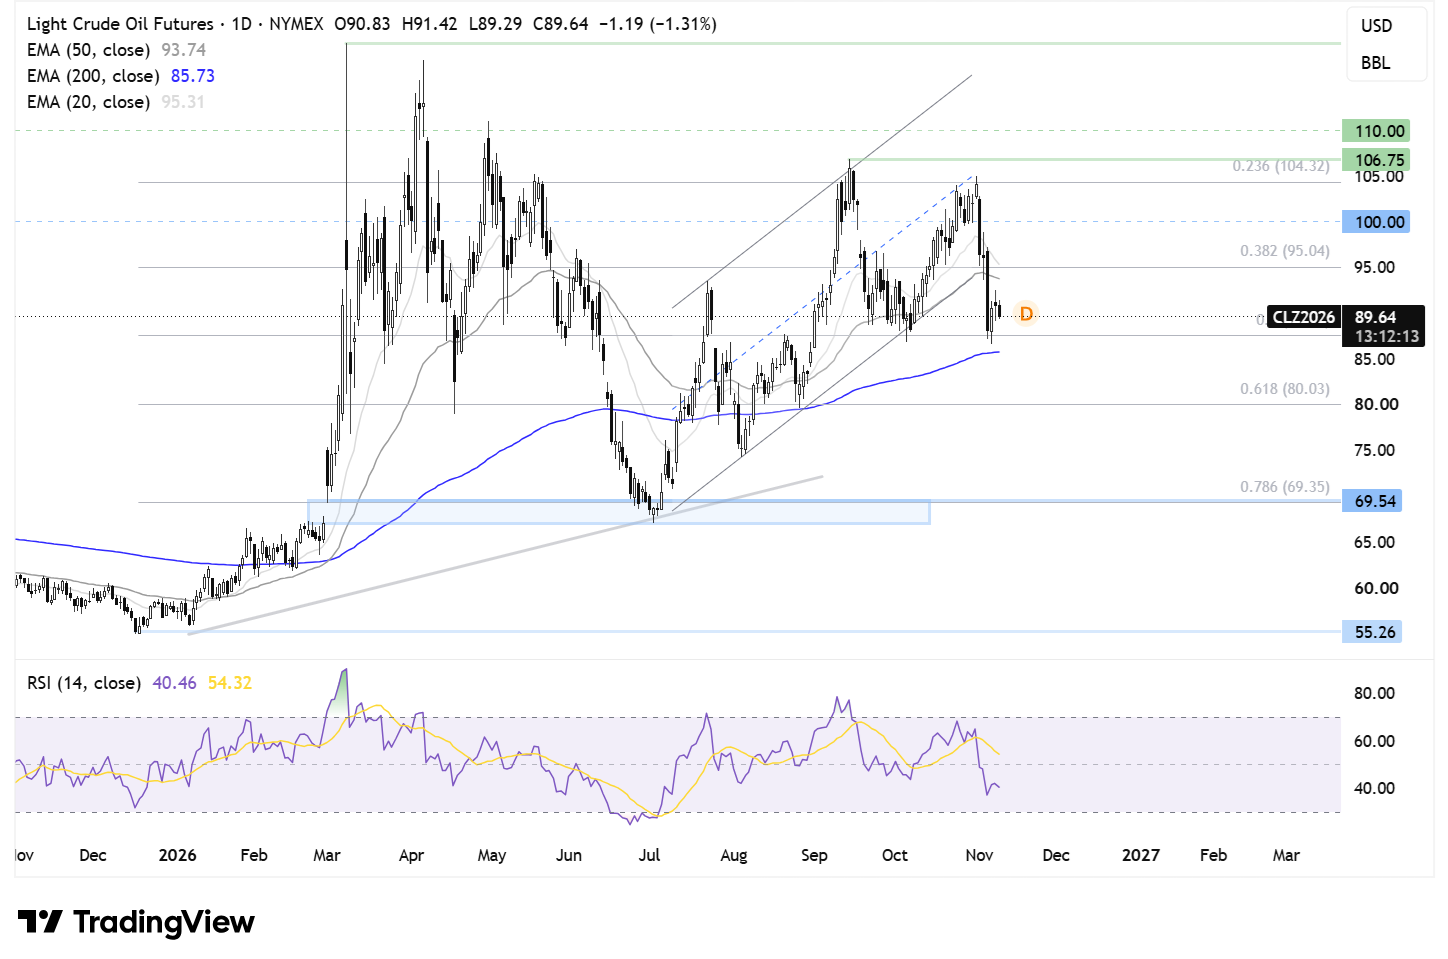
After running into resistance at $105, oil turned lower, breaking out of its rising channel and falling below the 50 EMA to find support around $88.
Sellers, supported by recent price action and the RSI below 50, will need to break below $88, the 50% Fibonacci retracement of the move from the $55 low to the $120 high, and below the 200 EMA at $85 in order to gain traction towards $80, the 61.8% Fibonacci level.
Should the $88 support hold, buyers will look to rise above the 50 EMA at $94 and the 38.2% Fibonacci retracement at $95. A rise above here turns attention to the $100 psychological level and $105, the 23.6% Fibonacci retracement. A move above $105 would create a higher high.
Related tags:
Latest market news




Open an account in minutes
Experience award-winning platforms with fast and secure execution, and enjoy tight spreads from 0.5 pts on FX and 0.3 pts on indices.
Economic calendar
Web Trader platform
Our sophisticated web-based platform is packed with features.
Related articles
EUR/USD, Oil Forecast: Two trades to watch 91126
EUR/USD rises, but the bearish outlook remains. Oil falls further as hopes of restraint and diplomacy in the Middle East rise.
Crude Oil Weekly Outlook: Houthi Attacks vs. a Double Top?
Crude oil weekly outlook: The Democratic win triggered a steep sell-off across crude oil charts, pushing WTI toward the neckline of a potential major double-top pattern. However, the new Congress does not take office until January, while persistent geopolitical risks—including the latest Houthi escalations—continue to keep a risk premium embedded in oil prices.

Euro Technical Forecast: EUR/USD Five-Week Range Puts Yearly Lows on the Line 11 7 2026
Euro support has held, but the bulls have struggled to gain ground as next week's U.S. CPI sets the stage for a potentially decisive EUR/USD breakout.

This report is intended for general circulation only. It should not be construed as a recommendation, or an offer (or solicitation of an offer) to buy or sell any financial products. The information provided does not take into account your specific investment objectives, financial situation or particular needs. Before you act on any recommendation that may be contained in this report, independent advice ought to be sought from a financial adviser regarding the suitability of the investment product, taking into account your specific investment objectives, financial situation or particular needs.
StoneX Financial Pte. Ltd., may distribute reports produced by its respective foreign entities or affiliates within the StoneX group of companies or third parties pursuant to an arrangement under Regulation 32C of the Financial Advisers Regulations. Where the report is distributed to a person in Singapore who is not an accredited investor, expert investor or an institutional investor (as defined in the Securities Futures Act), StoneX Financial Pte. Ltd. accepts legal responsibility to such persons for the contents of the report only to the extent required by law. Singapore recipients should contact StoneX Financial Pte. Ltd. at 6826 9988 for matters arising from, or in connection with the report.
In the case of all other recipients of this report, to the extent permitted by applicable laws and regulations neither StoneX Financial Pte. Ltd. nor its associated companies will be responsible or liable for any loss or damage incurred arising out of, or in connection with, any use of the information contained in this report and all such liability is hereby expressly disclaimed. No representation or warranty is made, express or implied, that the content of this report is complete or accurate.
StoneX Financial Pte. Ltd. is not under any obligation to update this report.
Trading CFDs carries a high level of risk that may not be suitable for some investors. Consider your investment objectives, level of experience, financial resources, risk appetite and other relevant circumstances carefully. The possibility exists that you could lose some or all of your investments, including your initial deposits. If in doubt, please seek independent expert advice. Visit www.forex.com/en-sg/terms-and-policies for the complete Risk Disclosure Statement.