




European Open: China’s PMI’s beat, Europe and US up next
A positive data set from China helped further lift sentiment overnight, after Wall Street had already handed Asian markets a positive lead.
Share this:

Asian Indices:
- Australia's ASX 200 index rose by 43.1 points (0.61%) and currently trades at 7,092.20
- Japan's Nikkei 225 index has fallen by -166.15 points (-0.49%) and currently trades at 33,892.60
- Hong Kong's Hang Seng index has fallen by -18.17 points (-0.08%) and currently trades at 22,694.85
- China's A50 Index has risen by 80.98 points (0.55%) and currently trades at 14,814.30
UK and Europe:
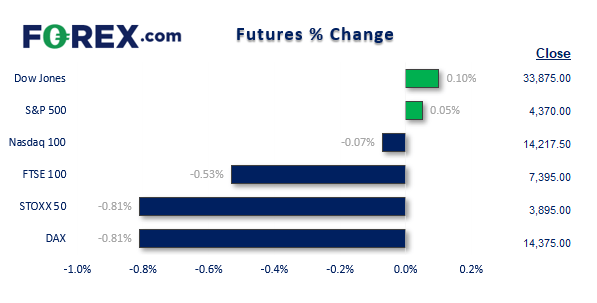
- UK's FTSE 100 futures are currently down -44.5 points (-0.6%), the cash market is currently estimated to open at 7,413.75
- Euro STOXX 50 futures are currently down -32.5 points (-0.83%), the cash market is currently estimated to open at 3,891.73
- Germany's DAX futures are currently down -117 points (-0.81%), the cash market is currently estimated to open at 14,344.02
US Futures:
- DJI futures are currently up 17 points (0.05%)
- S&P 500 futures are currently down -18.75 points (-0.13%)
- Nasdaq 100 futures are currently flat (0%)

Asian equity indices were mostly higher overnight with Japan’s TOPIX taking the lead with a 1% gain. The Hang Seng was the only major benchmark to trade lower although it is currently off by a mere -0.1%. Yet European futures have opened lower after talks between the Ukraine and Russia failed to provide a resolution to the conflict. US futures for the Dow and S&P 500 are slightly higher whilst the Nasdaq (yesterday’s top performer) is -0.7% lower form the prior close.
Heavy fighting in Ukraine continued after peace talks with Russia failed to achieve anything. Satellite images show what appears to be a 40-mile convoy of Russian tanks approaching Kiev. And (unverified) reports claim that 70 Ukrainian soldiers have been killed following heavy Russian artillery fire at a military base in Okhtyrka.
FTSE looks set to challenge 7500
This image will only appear on cityindex websites!

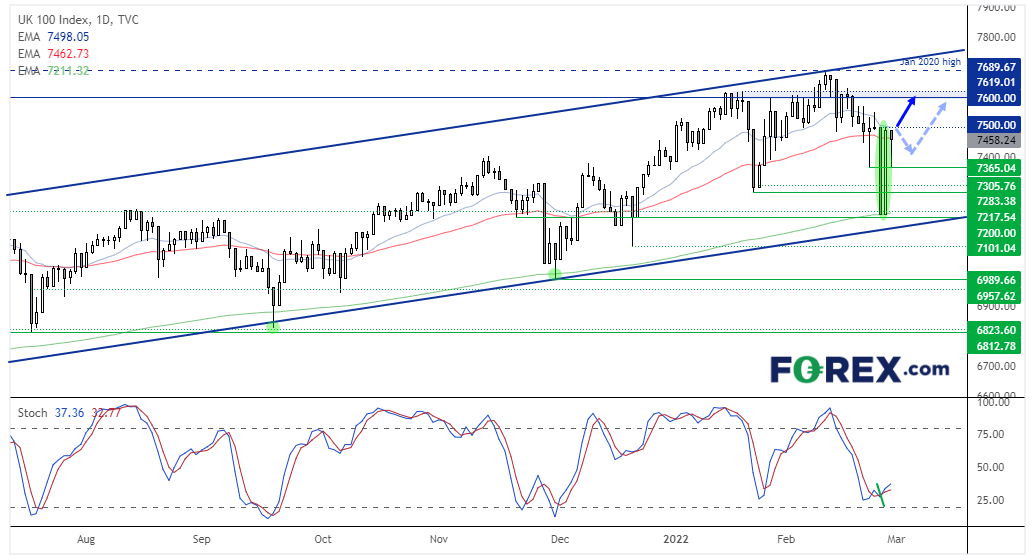
The FTSE 100 has once again rallied from its 200-day eMA after a failed intraday attempt to break beneath it. The September and November lows show a similar scenario, although Friday’s rally from the 200-day eMA is notable as it completely reversed the prior day’s losses. A stochastic buy signal and hammer formed yesterday which would be confirmed as a bullish reversal candle is prices break above 7500 today. And that should quickly bring the 7600/19 resistance zone and 7869 high into focus for bulls. Our bias remains bullish above 7365 should prices break above 7500 today.
FTSE 350: Market Internals

FTSE 350: 4187.69 (-0.42%) 28 March 2022
- 226 (64.20%) stocks advanced and 114 (32.39%) declined
- 12 stocks rose to a new 52-week high, 15 fell to new lows
Outperformers:
- + 31.93% - Oxford Instruments PLC (OXIG.L)
- + 13.37% - Chemring Group PLC (CHG.L)
- + 11.18% - Qinetiq Group PLC (QQ.L)
Underperformers:
- -56.01% - Polymetal International PLC (POLYP.L)
- -29.29% - EVRAZ plc (EVRE.L)
- -15.70% - Petropavlovsk PLC (POG.L)
China’s PMI’s come in above expectations
A mixture of state-backed and private PMI data for China’s service and manufacturing sectors expanded in January, according to data from NBS and Caixin. We know that PBOC have been busy easing lending restrictions which could partly explain the positive data set, although it is a bit of a bitter-sweet moment as we’re yet to see what impact, if any, the Ukraine crisis has on these global data sets going forward.
ISM manufacturing data at 15:00 GMT
The ISM is likely one of the longest running data sets used to assess the business cycle. The ISM peaked in March 2021 at a record high of 63.7 but as of January it had fallen to a 14-month low of 57.4 which shows growth potential is hitting headwind. Meanwhile the prices paid index remains historically high at 76.1 and if we are to see any sighs that inflationary pressures are abating, it would show up in the ISM PMI report first.
Gold and oil remain supported
Spot gold prices are showing sighs of stability above 1900, although we’re yet to see a daily close above the November high around 1916.5. Trading conditions are choppy and price action remain well within the $100 range printed last Thursday, so traders would be wise to remain nimble and not ‘marry’ their positions.
WTI is holding above 95.0 and trades around the midway point of a bullish channel on the daily chart. With current levels of volatility it could reach 100 within the next couple of days, should bulls retain control.
USD retraced against yesterday’s losses
Currency markets traded in tight ranges, although essentially retraced slightly against yesterday’s dollar-bearish moves. Markets have effectively binned the idea of a 50 bps hike from the Fed this month, with fewer hike also being priced in due to the Ukraine crisis. But we could see the US dollar weaken further today as Russia are showing no signs of backing off.
Up Next (Times in GMT)
How to trade with City Index
You can easily trade with City Index by using these four easy steps:
- Open an account, or log in if you’re already a customer
• Open an account in the UK
• Open an account in Australia
• Open an account in Singapore
- Search for the company you want to trade in our award-winning platform
- Choose your position and size, and your stop and limit levels
- Place the trade
How to trade with FOREX.com
Follow these easy steps to start trading with FOREX.com today:
- Open a Forex.com account, or log in if you’re already a customer.
- Search for the pair you want to trade in our award-winning platform.
- Choose your position and size, and your stop and limit levels.
- Place the trade.
Related tags:


Open an account in minutes
Experience award-winning platforms with fast and secure execution, and enjoy tight spreads from 0.5 pts on FX and 0.3 pts on indices.
Economic calendar
Web Trader platform
Our sophisticated web-based platform is packed with features.
Related articles
USD/CAD shooting star puts September surge on notice
USD/CAD has printed a clear bearish reversal pattern after an extraordinary September surge, but confirmation may depend heavily on how US Treasury yields react to Friday’s payrolls report.

USD/CHF Reverses as Swiss Franc Surges amid Bond Carnage
USD/CHF reverses from channel resistance as bond volatility surges and broad Swiss franc strength points to a possible carry-trade unwind.

USD/MXN Analysis: Is Super Peso Starting to Fade?
Over recent trading sessions, the Mexican peso has continued to show signs of weakness against the U.S. dollar. This can already be seen in USD/MXN, which has gained more than 1.7% over the last three sessions, highlighting sustained buying pressure in favor of the dollar in the short term.

This report is intended for general circulation only. It should not be construed as a recommendation, or an offer (or solicitation of an offer) to buy or sell any financial products. The information provided does not take into account your specific investment objectives, financial situation or particular needs. Before you act on any recommendation that may be contained in this report, independent advice ought to be sought from a financial adviser regarding the suitability of the investment product, taking into account your specific investment objectives, financial situation or particular needs.
StoneX Financial Pte. Ltd., may distribute reports produced by its respective foreign entities or affiliates within the StoneX group of companies or third parties pursuant to an arrangement under Regulation 32C of the Financial Advisers Regulations. Where the report is distributed to a person in Singapore who is not an accredited investor, expert investor or an institutional investor (as defined in the Securities Futures Act), StoneX Financial Pte. Ltd. accepts legal responsibility to such persons for the contents of the report only to the extent required by law. Singapore recipients should contact StoneX Financial Pte. Ltd. at 6826 9988 for matters arising from, or in connection with the report.
In the case of all other recipients of this report, to the extent permitted by applicable laws and regulations neither StoneX Financial Pte. Ltd. nor its associated companies will be responsible or liable for any loss or damage incurred arising out of, or in connection with, any use of the information contained in this report and all such liability is hereby expressly disclaimed. No representation or warranty is made, express or implied, that the content of this report is complete or accurate.
StoneX Financial Pte. Ltd. is not under any obligation to update this report.
Trading CFDs carries a high level of risk that may not be suitable for some investors. Consider your investment objectives, level of experience, financial resources, risk appetite and other relevant circumstances carefully. The possibility exists that you could lose some or all of your investments, including your initial deposits. If in doubt, please seek independent expert advice. Visit www.forex.com/en-sg/terms-and-policies for the complete Risk Disclosure Statement.