




EUR/USD Analysis: Debt ceiling negotiations set to resume, PMIs up next
The debt ceiling negotiations drag on for at least another day (and likely for the rest of the week). For now we can focus on today’s flash PMIs and how EUR/USD reacts.
Share this:

Asian Indices:
- Australia's ASX 200 index rose by 9.2 points (0.13%) and currently trades at 7,272.50
- Japan's Nikkei 225 index has risen by 278.47 points (0.9%) and currently trades at 31,086.82
- Hong Kong's Hang Seng index has fallen by -114.58 points (-0.58%) and currently trades at 19,563.59
- China's A50 Index has fallen by -96.41 points (-0.74%) and currently trades at 13,019.12
UK and Europe:
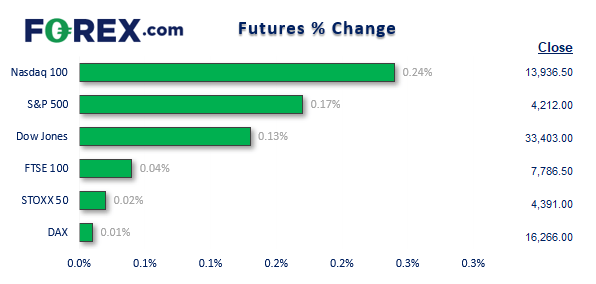
- UK's FTSE 100 futures are currently up 4 points (0.05%), the cash market is currently estimated to open at 7,774.99
- Euro STOXX 50 futures are currently up 1 points (0.02%), the cash market is currently estimated to open at 4,386.63
- Germany's DAX futures are currently up 3 points (0.02%), the cash market is currently estimated to open at 16,226.99
US Futures:
- DJI futures are currently up 43 points (0.13%)
- S&P 500 futures are currently up 7 points (0.17%)
- Nasdaq 100 futures are currently up 32.75 points (0.24%)

- Whilst the highly anticipated debt ceiling negotiations failed to end in an agreement, both parties called their discussions productive and vowed to continue pressing ahead to avert a US default
- As we’ve said before, this will likely go on for some time as both parties are seemingly happy to run down the clock in a big game of chicken, before the debt ceiling will likely be lifted anyway
- Right now it is about who can score the most concessions before we hit that moment of panic
- This has seen volatility for currencies on the low side and equity performance mixed
- Japan’s manufacturing PMI rose to its highest rate of expansion in even months, initially seeing USD/JPY pull back from its highs before making a half-hearted attempt to reach a new cycle high
- The Nikkei extended its lead to a 33-year high thanks to a weaker yen and hopes of a debt ceiling resolution, before handing back the day’s gains near the end of the session
- BOE’s Andrew Bailey, Huw Pill, Silvana Tenreyro and Catherine L Mann are set to speak at the Treasury Selecting Hearings on the May Monetary Policy Report, from 10:15 BST
- Flash PMI data for the UK, Europe and US are the main economic repots today, with France and Germany kicking off at 08:15, the eurozone at 08:30 and the UK at 09:30
Flash PMI data for May is released today
We can see that the composite PMIs for the UK, Europe and US are all trending higher which shows the economies have growth potential in the months ahead. However, it is the services sectors which are doing all of the heavily lifting in a post-Covid world with manufacturing sectors continuing to contract across the globe. But perhaps we’ll see an upside surprise, given Australia’s manufacturing contracted at a slower pace and Japan’s manufacturing sector threw in a cheeky expansion.
But what we’d really like to see is a divergence between the numbers to help prompt a suitable currency pair reaction. Given business sentiment for Germany and the broader eurozone are falling, perhaps it will also show up in today’s PMI figures. And if that were to be coupled with better-than-expected US data and a debt-ceiling deal, EUR/USD could find itself under some selling pressure.
EUR/USD 1-hour chart
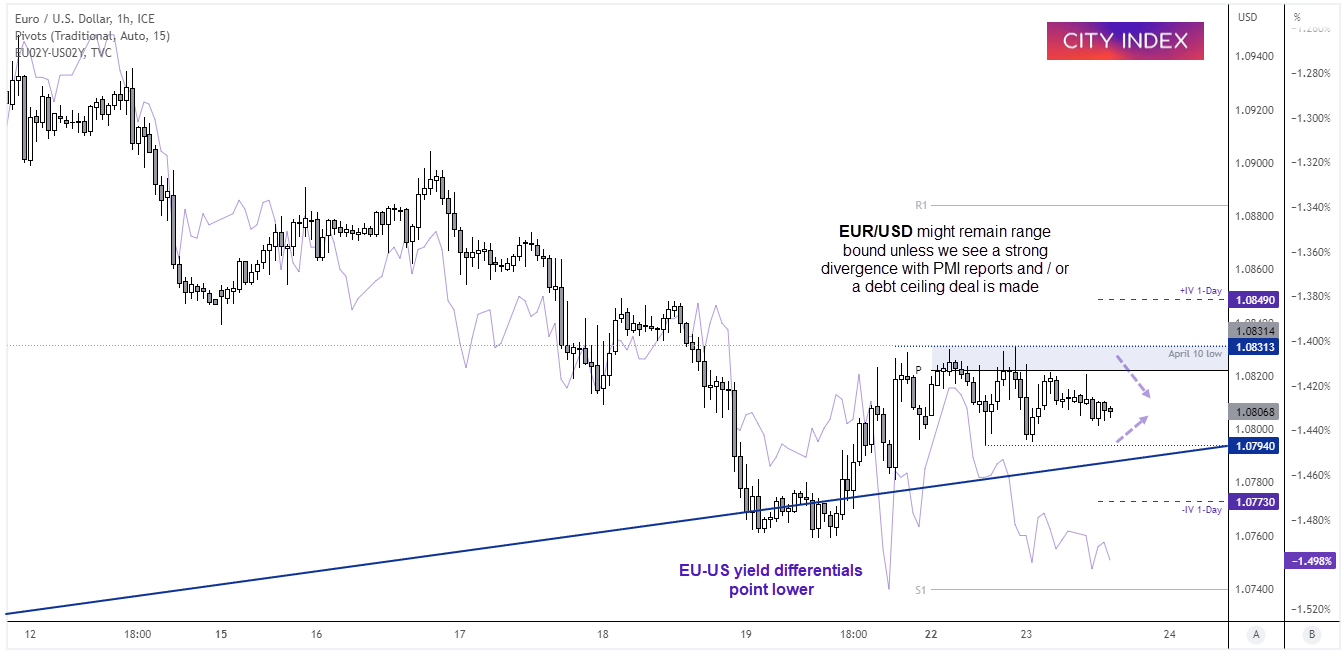
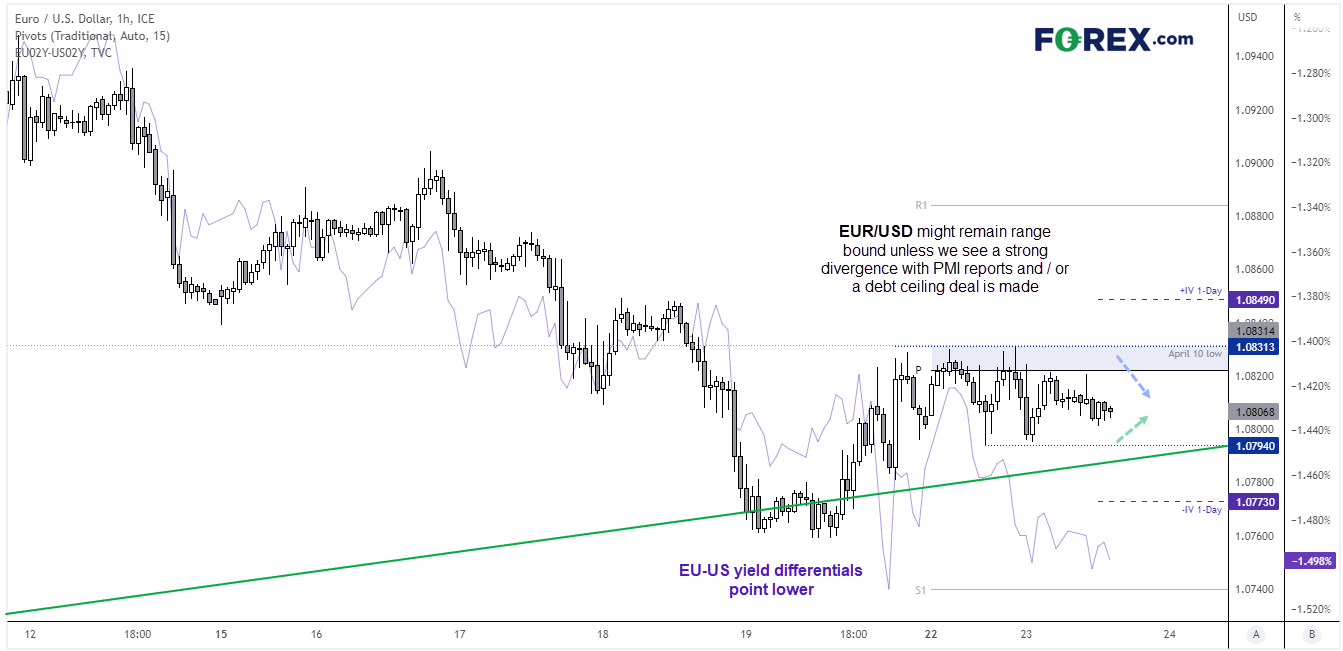
EUR/USD finds itself between a rock and a hard place having flicked through the timeframes. Whilst a bearish trend has formed on the 1-hour chart, prices fid themselves within a choppy consolidation just above 1.0800. Last week’s low also formed around a key trendline from the 2022 low yet, at the same time, this week’s highs have met resistance at the weekly pivot point and April 10 low.
Unless we see a clear divergence in today’s PMI reports, we run the risk of lower volatility and for prices to remain in its choppy range. But if it can break out of range, take note that the 1-day implied volatility band sits around 1.0773 – 1.0850. A break above 1.0835 suggest a bullish breakout of the current consolidation.
Economic events up next (Times in GMT+1)
-- Written by Matt Simpson
Follow Matt on Twitter @cLeverEdge
How to trade with City Index
You can trade with City Index by following these four easy steps:
- Open an account, or log in if you’re already a customer
• Open an account in the UK
• Open an account in Australia
• Open an account in Singapore
- Search for the market you want to trade in our award-winning platform
- Choose your position and size, and your stop and limit levels
- Place the trade
European market open FAQs
What is the European market open time?
The European market opens at 08:00 (UTC) when the London Stock Exchange starts trading. The Euronext group exchange – which includes Amsterdam, Paris, Lisbon, Dublin, Oslo and Brussels – opens later at 09:00 (UTC).
See our stock trading hours
See our stock trading hours
What time do European stock markets close?
European stock markets close at 17:40 (UTC), when the Amsterdam session of the Euronext concludes. All other European exchanges finish trading earlier – the London Stock Exchange closes at 16:30 (UTC), while the other Euronext locations close at 17:30 (UTC).
See our index trading hours
What is the European stock market called?
The European stock market is the Euronext, which is made up of several different exchanges across Europe. Euronext operates exchanges in Paris, Amsterdam, Brussels, Lisbon, Dublin, Oslo, and Milan. As of 2023, Euronext is the largest exchange in Europe and the fourth largest in the world by market capitalisation of listed companies.
What is the main European stock index?
The main European stock indices to track are the DAX (Germany 40), CAC 40 (France 40) and the STOXX Europe 50 index (EU Stocks 50).
The FTSE 100 is also a popular European index to monitor – although the UK is no longer part of the EU, it remains economically linked to its European neighbours.
Discover how to trade indices
The main European stock indices to track are the DAX (Germany 40), CAC 40 (France 40) and the STOXX Europe 50 index (EU Stocks 50).
The FTSE 100 is also a popular European index to monitor – although the UK is no longer part of the EU, it remains economically linked to its European neighbours.
Discover how to trade indices
Related tags:

Open an account in minutes
Experience award-winning platforms with fast and secure execution, and enjoy tight spreads from 0.5 pts on FX and 0.3 pts on indices.
Economic calendar
Web Trader platform
Our sophisticated web-based platform is packed with features.
Related articles

US Dollar Technical Outlook: DXY Bulls Meet Resistance at Yearly Highs 10 1 2026
The U.S. Dollar has held firm despite fading Fed hike bets, but Friday’s payrolls could test the rally’s staying power.


EUR/USD, GBP/USD Outlook: RSI Hits 2020 Oversold Levels
EUR/USD, GBP/USD Outlook: The EUR/USD daily RSI has fallen to oversold levels last seen in 2020, raising the risk of a reversal across correlated currency pairs, including the US dollar and GBP/USD.


Dow Jones forecast: Stock markets under pressure from multiple sources
When looking at the major tech-heavy US indices like the S&P 500 or the Nasdaq 100, you wouldn’t think that the stock market is particularly weak. Yet, beneath the surface, the market is far from healthy right now. Investors are evidently just piling into the big tech and AI names, and as a result, market breadth is deteriorating. Other indices like the small cap Russell 2000 and the Dow Jones are starting to reflect that weakness.

This report is intended for general circulation only. It should not be construed as a recommendation, or an offer (or solicitation of an offer) to buy or sell any financial products. The information provided does not take into account your specific investment objectives, financial situation or particular needs. Before you act on any recommendation that may be contained in this report, independent advice ought to be sought from a financial adviser regarding the suitability of the investment product, taking into account your specific investment objectives, financial situation or particular needs.
StoneX Financial Pte. Ltd., may distribute reports produced by its respective foreign entities or affiliates within the StoneX group of companies or third parties pursuant to an arrangement under Regulation 32C of the Financial Advisers Regulations. Where the report is distributed to a person in Singapore who is not an accredited investor, expert investor or an institutional investor (as defined in the Securities Futures Act), StoneX Financial Pte. Ltd. accepts legal responsibility to such persons for the contents of the report only to the extent required by law. Singapore recipients should contact StoneX Financial Pte. Ltd. at 6826 9988 for matters arising from, or in connection with the report.
In the case of all other recipients of this report, to the extent permitted by applicable laws and regulations neither StoneX Financial Pte. Ltd. nor its associated companies will be responsible or liable for any loss or damage incurred arising out of, or in connection with, any use of the information contained in this report and all such liability is hereby expressly disclaimed. No representation or warranty is made, express or implied, that the content of this report is complete or accurate.
StoneX Financial Pte. Ltd. is not under any obligation to update this report.
Trading CFDs carries a high level of risk that may not be suitable for some investors. Consider your investment objectives, level of experience, financial resources, risk appetite and other relevant circumstances carefully. The possibility exists that you could lose some or all of your investments, including your initial deposits. If in doubt, please seek independent expert advice. Visit www.forex.com/en-sg/terms-and-policies for the complete Risk Disclosure Statement.