



EURUSD, DXY Price Outlook: Double Top and Bottom Scenarios
EURUSD, DXY Price Outlook: double top and bottom scenarios can be seen on the US Dollar Index and EURUSD charts, as price action holds in consolidation in tandem with crude’s hold near $90. With no resolution in sight, is another breakout on the horizon?
Share this:

Double top and bottom scenarios can be seen on the US Dollar Index and EURUSD charts, as price action holds in consolidation in tandem with crude’s hold near $90. With no resolution in sight, further market drawdown risks are building.
CNN Fear and Greed Index
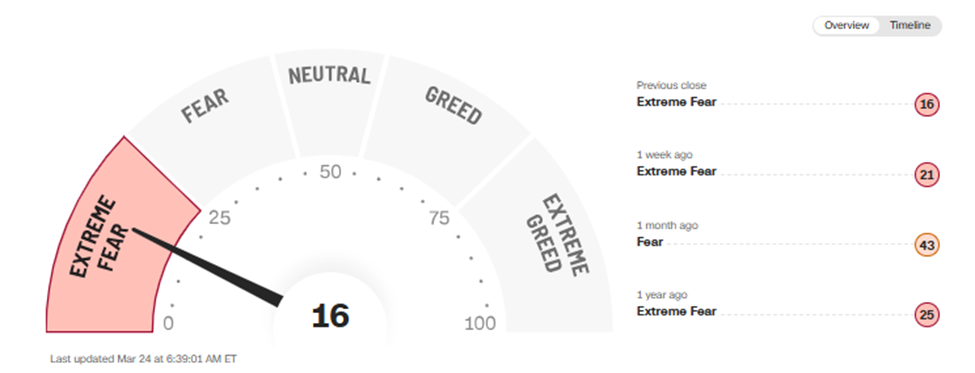
Source: CNN
The index dropped to 10 yesterday, marking extreme fear levels last seen in April 2025 amid reciprocal tariff rhetoric, keeping bearish scenarios intact.
Trump’s comments regarding positive negotiations with Iran, including a potential postponement of strikes on key power plants, briefly lifted market sentiment. However, this move was quickly reversed following Iran’s denial of such developments.
As a result, sentiment remains firmly in bearish territory, with the index only recovering marginally from 10 to 16. Key levels remain in focus to confirm any meaningful structural shifts on the crude, dollar, and EURUSD charts, whether for dip-buying opportunities or trend-following setups.
Key Levels to Watch:
• DXY: 100.50 resistance, 98.80-98 support
• EURUSD: 1.1660 resistance, 1.14 support
DXY Monthly Outlook – Log Scale

Source: Trading View
The broader view for the index from the 2008 low remains bullish, as price action holds above the 96 mark and the lower bound of the respected 18-year channel. A possible double bottom formation can be seen extending on the chart between the lows of June 2025 and January 2026, testing the 100.50 neckline.
Bullish scenario:
Closing back above 99.50 and 100.50 exposes the index to a bullish breakout towards the 101.80 and 104.40 marks, completing a double bottom reversal target. This scenario would likely coincide with Middle East conflict escalations, leading to further disruptions in oil supply routes and facilities, contributing to higher inflation risks and more hawkish rate policies.
Bearish scenario:
Closing back below the 98.80 mark extends bearish forecasts down towards the 98.50 and 98 marks for a potential bullish hold. If not, a deeper retracement exposes the index to another test of the channel’s borders near the 96 zone, reinforcing either another bullish rebound or a long-term bearish breakout. This scenario would likely coincide with US–Middle East conflict de-escalation and oil price unwinds.
EURUSD 2-Week Outlook – Log Scale
Source: Trading View
The analysis on EURUSD is quite similar to the DXY, on the inverse. There is consolidation below the 1.20 mark extending on the charts between June 2025 and January 2026, taking the shape of a possible double top pattern formation.
Bearish scenario
Closing below the double top neckline at the 1.14 zone exposes the pair to an extended drawdown back towards the upper bound of a respected down trending channel since the highs of 2008, near the 1.12–1.11 zone, for a dip-buying opportunity. Falling back below this zone and within the bounds of this channel reinforces longer-term dominance for the dollar against the euro once again. This scenario aligns with the DXY’s bullish scenario mentioned earlier.
Bullish scenario
Closing back above the 1.1660 level extends gains towards the 1.1760 and 1.1860 marks, re-exposing the pair to further upside towards the 1.20 mark and potentially towards the 2022 and 2018 highs near 1.23 and 1.25.
Written by Razan Hilal, CMT
Follow on X: @Rh_waves


Open an account in minutes
Experience award-winning platforms with fast and secure execution, and enjoy tight spreads from 0.5 pts on FX and 0.3 pts on indices.
Economic calendar
Web Trader platform
Our sophisticated web-based platform is packed with features.
Related articles
EUR/USD forecast remains tilted lower with French bond troubles ahead of US jobs report
The EUR/USD has tagged a fresh year-to-date low as French public-finance concerns trigger a government bond sell-off. Today's US jobs report may change little, with resilient activity, elevated energy prices and hawkish Fed bets keeping the greenback supported. With the pair trapped below resistance at 1.1410, the risk to the near-term EUR/USD forecast is tilted to the downside.

What Stretched 10-Year Yields Mean for Major Currency Pairs in Q4
U.S. 10-year Treasury yields are nearing a long-term resistance zone with overbought RSI readings, raising near-term pullback risk for the dollar.

USD/MXN Analysis: Is Super Peso Starting to Fade?
Over recent trading sessions, the Mexican peso has continued to show signs of weakness against the U.S. dollar. This can already be seen in USD/MXN, which has gained more than 1.7% over the last three sessions, highlighting sustained buying pressure in favor of the dollar in the short term.

This report is intended for general circulation only. It should not be construed as a recommendation, or an offer (or solicitation of an offer) to buy or sell any financial products. The information provided does not take into account your specific investment objectives, financial situation or particular needs. Before you act on any recommendation that may be contained in this report, independent advice ought to be sought from a financial adviser regarding the suitability of the investment product, taking into account your specific investment objectives, financial situation or particular needs.
StoneX Financial Pte. Ltd., may distribute reports produced by its respective foreign entities or affiliates within the StoneX group of companies or third parties pursuant to an arrangement under Regulation 32C of the Financial Advisers Regulations. Where the report is distributed to a person in Singapore who is not an accredited investor, expert investor or an institutional investor (as defined in the Securities Futures Act), StoneX Financial Pte. Ltd. accepts legal responsibility to such persons for the contents of the report only to the extent required by law. Singapore recipients should contact StoneX Financial Pte. Ltd. at 6826 9988 for matters arising from, or in connection with the report.
In the case of all other recipients of this report, to the extent permitted by applicable laws and regulations neither StoneX Financial Pte. Ltd. nor its associated companies will be responsible or liable for any loss or damage incurred arising out of, or in connection with, any use of the information contained in this report and all such liability is hereby expressly disclaimed. No representation or warranty is made, express or implied, that the content of this report is complete or accurate.
StoneX Financial Pte. Ltd. is not under any obligation to update this report.
Trading CFDs carries a high level of risk that may not be suitable for some investors. Consider your investment objectives, level of experience, financial resources, risk appetite and other relevant circumstances carefully. The possibility exists that you could lose some or all of your investments, including your initial deposits. If in doubt, please seek independent expert advice. Visit www.forex.com/en-sg/terms-and-policies for the complete Risk Disclosure Statement.