



EUR/USD Forecast: Is the euro still losing the battle?
The first week of June begins with the euro showing renewed signs of short-term weakness. This can be seen in recent EUR/USD price action, with the pair falling more than 0.2% during the session.
Share this:
The first week of June begins with the euro showing renewed signs of short-term weakness. This can be seen in recent EUR/USD price action, with the pair falling more than 0.2% during the session.
The new selling pressure comes as the US dollar shows greater stability, supported by Middle East updates that have renewed demand for the US currency. If this effect continues, the current selling pressure could remain relevant in EUR/USD over the coming trading sessions.


Middle East tensions remain in focus
At the start of this trading week, concerns around the Middle East conflict became relevant again. New reports showed attacks between both sides, which could put peace negotiations and stability around the Strait of Hormuz at risk. In fact, there were also reports of a possible suspension of direct talks in the short term, once again complicating the geopolitical outlook in the region and lifting the market’s risk premium.
This situation has already started to create relevant short-term effects. WTI crude oil moved back above the $90 area, reviving concerns about potential inflationary pressures in a context where energy commodities have not managed to decline sustainably.
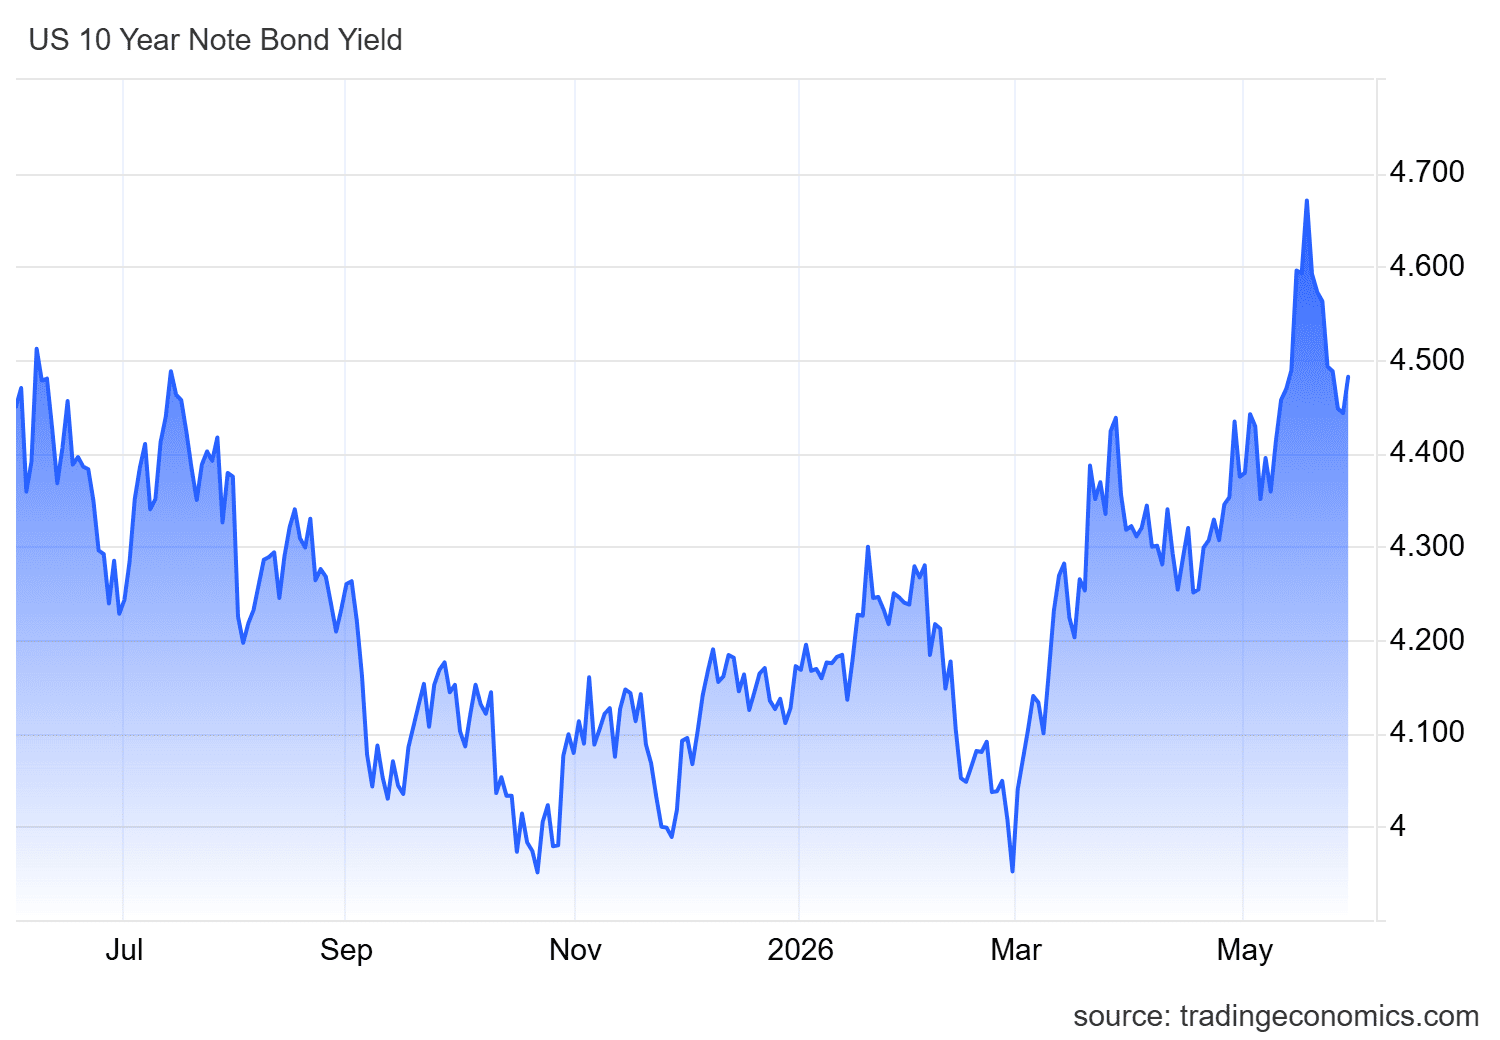
This scenario could also feed expectations of a more aggressive Federal Reserve, especially in the United States, and has supported a recovery in bond yields. The US 10-year Treasury yield has shown a short-term rebound, maintains a positive slope, and is moving back toward the 4.5% area. This increases the appeal of US bonds, especially when compared with other regions such as Europe.
Source: TradingEconomics
This dynamic has acted as short-term support for the US dollar. First, because the dollar tends to behave as a safe-haven currency during periods of geopolitical uncertainty. Second, because a more attractive US bond market can draw foreign capital and stabilize demand for dollars.
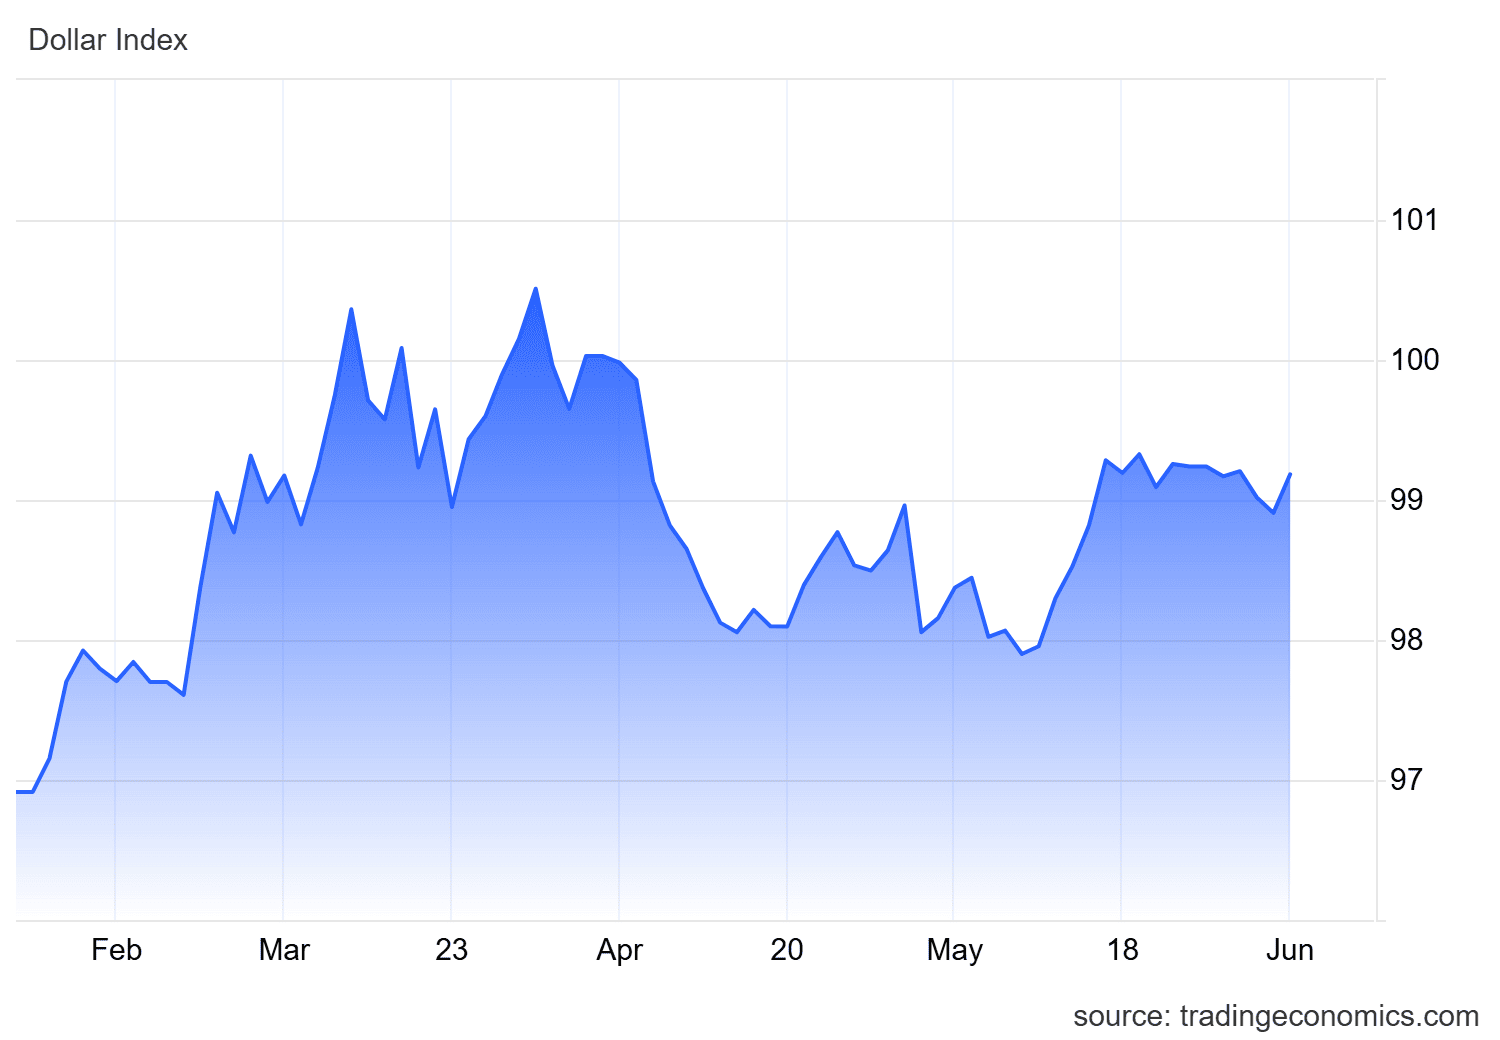
This effect can already be seen in recent movements of DXY, the index that measures the dollar’s strength against its main rivals. The index is now back above the 99-point area, showing a consistent recovery in dollar demand in the short term.
Source: TradingEconomics
The dynamic remains similar to previous weeks: as long as Middle East tensions stay elevated and this supports the US bond market, demand linked to these events could make it difficult for the euro to recover ground consistently. In this scenario, selling pressure could remain present in EUR/USD over the coming sessions.
Could inflation readings be relevant for the euro?
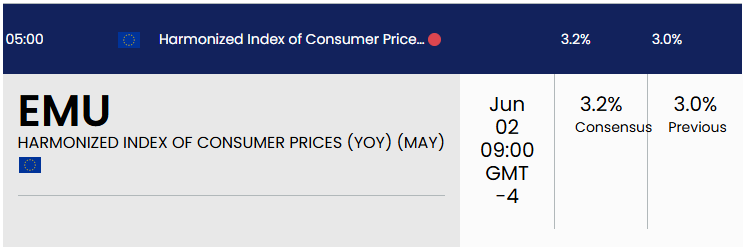
Tomorrow, June 2, the HICP y/y inflation reading for the European region is expected. The figure is estimated to come in 3.2%, above the previous 3.00% reading. This would not only point to additional inflationary pressures but also move inflation further away from the European Central Bank’s 2.00% CPI annual average target.
Source: Data - FXSTREET
At this stage, the ECB Watch probability table already shows a 92% probability that the European Central Bank will raise rates by 25 basis points at the June 10 decision. However, for the July 22 meeting, there is still a probability of near 66% that the deposit rate will remain unchanged after a possible increase toward 2.25%.
This is where the inflation data becomes important. If inflation comes above expectations and remains far from the central bank’s target, the market could start pricing in a stricter ECB stance for the decisions after June. In that case, expectations of higher rates in Europe could help stabilize demand for the euro over the medium term.
Therefore, beyond the current selling pressure in EUR/USD, the inflation reading could open the door to a stronger phase of indecision on the chart over the medium term if it reinforces expectations of a more restrictive European Central Bank.
Technical outlook for EUR/USD
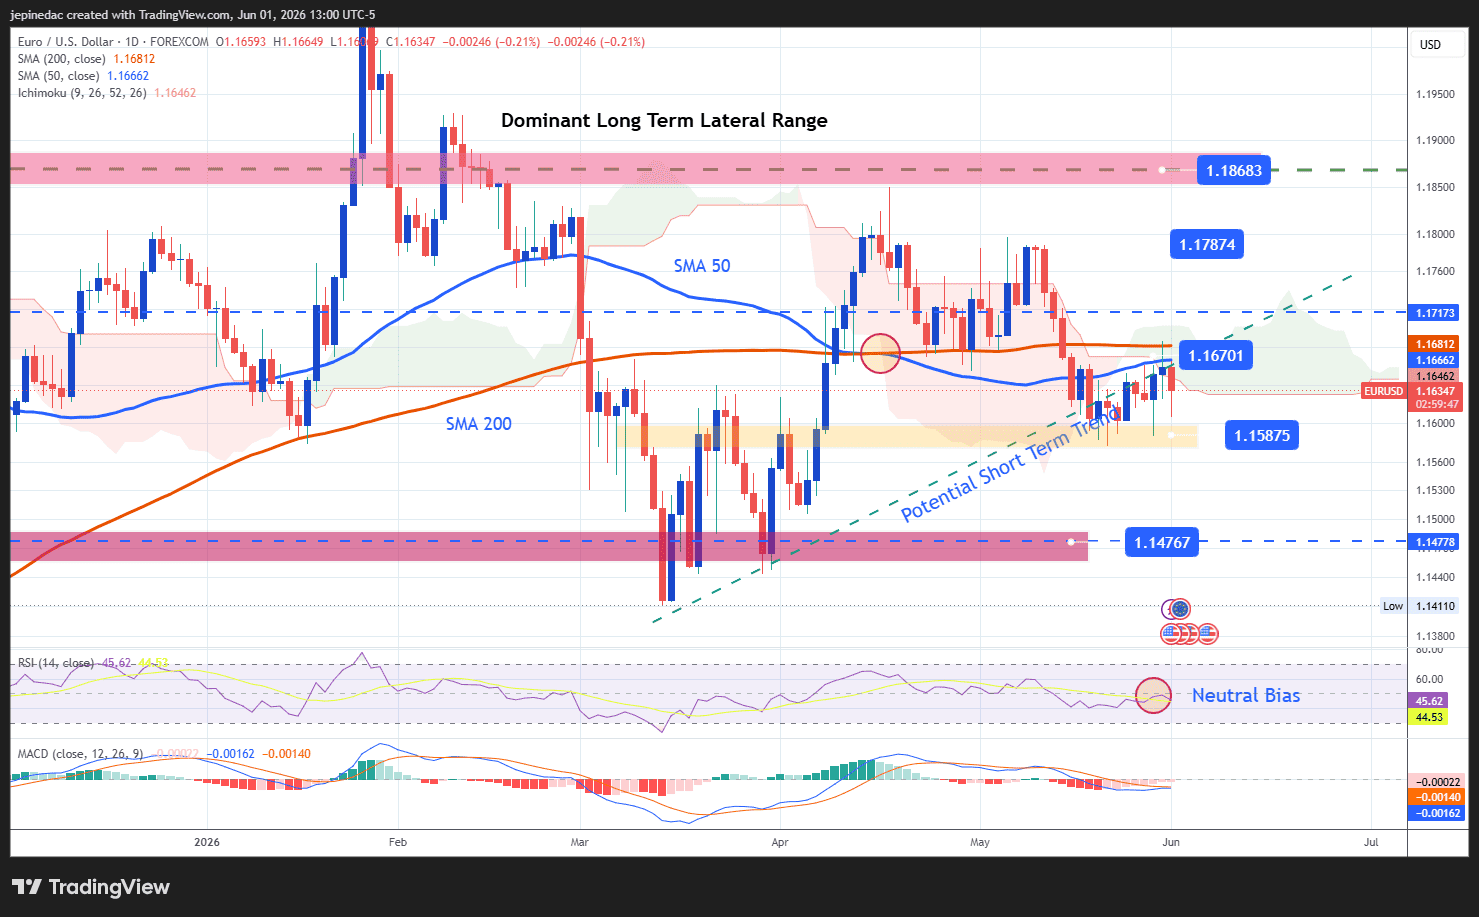
Source: StoneX, Tradingview
- Potential trendline starts to lose relevance: Although recent EUR/USD movements had been trying to keep a possible bullish trendline in play, the neutrality of recent sessions has started to weaken this structure. For now, a broad long-term sideways channel continues to dominate, marked between the upper area of 1.18683 and the lower area of 1.14767. As long as indecision remains present in price action, this sideways channel could continue to be the most relevant structure to watch over the coming sessions.
- RSI: Now, the RSI remains close to the neutral 50 level, suggesting a balance between short-term bullish and bearish momentum. This also leaves room for a phase of indecision if current buying pressure fails to consolidate on the chart.
- MACD: A similar scenario can be seen in the MACD, as the histogram remains close to the 0 line. This suggests a balance in the strength of short-term moving averages and also highlights the importance of the indecision phase that has started to form in the market.
Key levels:
- 1.17874 – Relevant resistance: This level corresponds to current highs and stands as the most important upside barrier to watch. Price movements above this zone could open the door to new highs and consolidate short-term buying strength, bringing a possible bullish trend line back into focus as the dominant pattern over the coming sessions.
- 1.16701 – Near-term barrier: A neutral level that coincides with the 50- and 200-period moving averages, making it one of the most relevant areas to monitor in the short term. Price action that stays too close to this level could extend the neutrality phase, weaken the possible short-term trendline, and keep the broad sideways range from recent months as the dominant structure.
- 1.15875 – Definitive support: A level located below the moving averages that acts as a relevant retracement area. A break below this level could start to confirm a more consistent selling bias and open the door to stronger selling pressure in the following sessions, putting the euro’s short-term strength into question.
Written by Julian Pineda, CFA, CMT – Market Analyst
Follow him on: @julianpineda25
Latest market news




Open an account in minutes
Experience award-winning platforms with fast and secure execution, and enjoy tight spreads from 0.5 pts on FX and 0.3 pts on indices.
Economic calendar
Web Trader platform
Our sophisticated web-based platform is packed with features.
Related articles
USD/CHF Feels the Weight of US Midterms, USD/CAD Clings to Support
US midterms threaten fresh dollar volatility as USD/CHF tests technical support and USD/CAD clings to 1.3940 ahead of election results.

US Dollar, GBP/USD, USD/CAD, USD/CHF, Gold Weekly Technical Outlook 11 2 2026
Sr. Technical Strategist Michael Boutros highlights the levels that matter on the USD Majors, commodities, and equity indices charts this week.

US Midterm Forecast: The Key Risks for Traders to Watch Through the US Elections
Prediction markets are pricing in nearly 75% odds of a Democratic sweep in this week’s US midterm elections, a development that would result in a split from the single party Republican rule of the past two years - what will it mean for markets?

This report is intended for general circulation only. It should not be construed as a recommendation, or an offer (or solicitation of an offer) to buy or sell any financial products. The information provided does not take into account your specific investment objectives, financial situation or particular needs. Before you act on any recommendation that may be contained in this report, independent advice ought to be sought from a financial adviser regarding the suitability of the investment product, taking into account your specific investment objectives, financial situation or particular needs.
StoneX Financial Pte. Ltd., may distribute reports produced by its respective foreign entities or affiliates within the StoneX group of companies or third parties pursuant to an arrangement under Regulation 32C of the Financial Advisers Regulations. Where the report is distributed to a person in Singapore who is not an accredited investor, expert investor or an institutional investor (as defined in the Securities Futures Act), StoneX Financial Pte. Ltd. accepts legal responsibility to such persons for the contents of the report only to the extent required by law. Singapore recipients should contact StoneX Financial Pte. Ltd. at 6826 9988 for matters arising from, or in connection with the report.
In the case of all other recipients of this report, to the extent permitted by applicable laws and regulations neither StoneX Financial Pte. Ltd. nor its associated companies will be responsible or liable for any loss or damage incurred arising out of, or in connection with, any use of the information contained in this report and all such liability is hereby expressly disclaimed. No representation or warranty is made, express or implied, that the content of this report is complete or accurate.
StoneX Financial Pte. Ltd. is not under any obligation to update this report.
Trading CFDs carries a high level of risk that may not be suitable for some investors. Consider your investment objectives, level of experience, financial resources, risk appetite and other relevant circumstances carefully. The possibility exists that you could lose some or all of your investments, including your initial deposits. If in doubt, please seek independent expert advice. Visit www.forex.com/en-sg/terms-and-policies for the complete Risk Disclosure Statement.