





EUR/USD Rallies from Key Support, Tests 1.0800
EUR/USD has sold off for six days in a row, but is now catching a bounce from the 200-day moving average.
Share this:

EUR/USD, Euro Talking Points:
- It’s been a consistent sell-off for EUR/USD since the FOMC rate decision last week, with the pair printing six consecutive red daily candles.
- EUR/USD made a push into a key zone of support in late trade yesterday, and that’s so far brought a bounce. This doesn’t necessarily mean reversal of trend but it has allowed for a pullback to 1.0800, which sellers have so far responded to.
- EUR/USD and the U.S. Dollar are large focal points in each Tuesday webinar, and you’re welcome to join the next. Click here for registration information.
Trend can change quickly in the FX market, and we’ve seen that in the month of March in EUR/USD.
The pair started out the month with one of its strongest bullish breakouts ever, with a breach of the 1.0533 and 1.0600 resistance levels leading to strong topside moves. Buyers continued to push all the way into the 1.0943 Fibonacci level, which first came into play a couple weeks ago; and while bulls persisted for a little more than a week later, that same 1.0943 level refused to yield to breakout, and it was last Wednesday’s candle, around the FOMC rate decision, which sellers started to take over again.
Since then, it’s been an open pathway for bears. It hasn’t been an aggressive push as prices pulled back by about 200 pips over that time in a somewhat controlled manner.
This has all taken place in a very clean format, and I’ve looked at this in webinars over the past two weeks, with the pre-FOMC webinar highlighting a possible turn and then this Tuesday’s webinar highlighting the support test at the 1.0750 level which is confluent with the 200-day moving average. That spot came into play last night and is now leading into a bounce.
EUR/USD Daily Price Chart
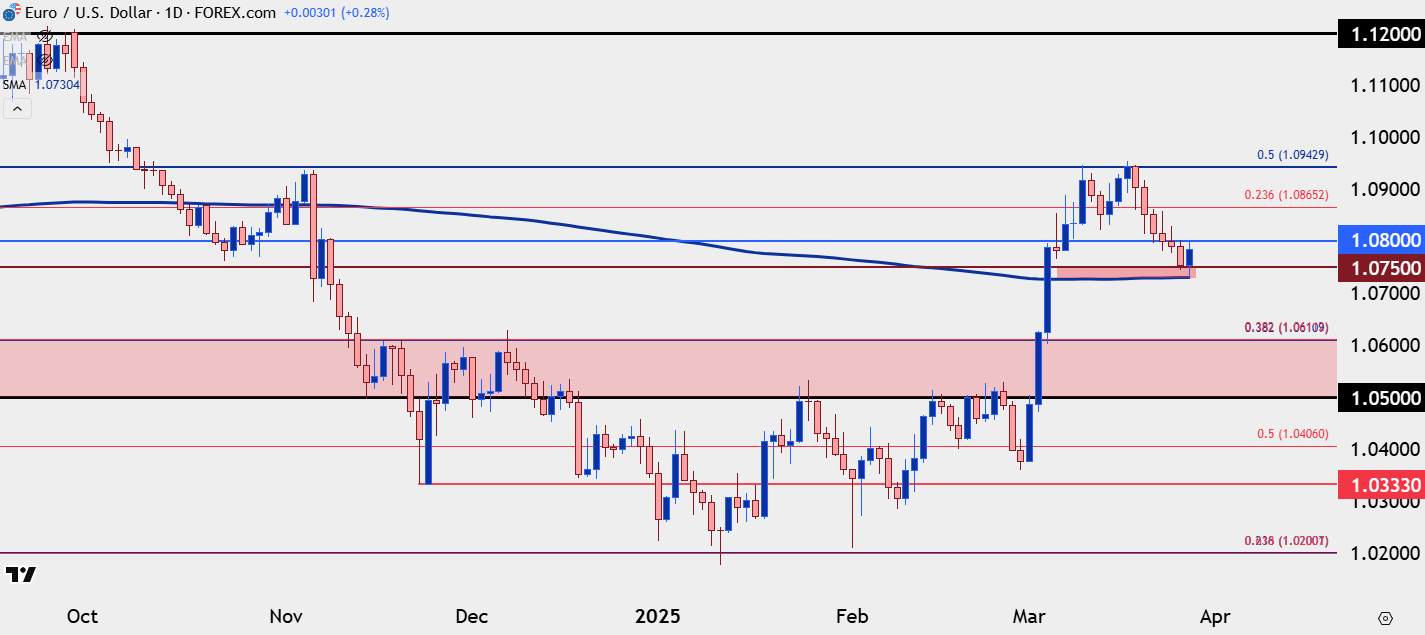 Chart prepared by James Stanley; data derived from Tradingview
EUR/USD Overbought Conditions Rectified
One of the more compelling items pointing to pullbacks a week ago was the RSI divergence that had built on the daily chart of EUR/USD; and the mirror image of that was an RSI divergence of oversold on the U.S. Dollar chart.
Both conditions have now been rectified after pullbacks in each market. The question now is one of continuation: Do we see the shorter-term bearish trend in EUR/USD continue down to fresh lows as more of the March move gets priced-out? Or do we see bulls respond to the pullback from the massive breakout that showed earlier in the month of March?
We’re nearing a spot on the economic calendar where some volatility in the US Dollar and related pairs can be expected. Tomorrow brings the Fed’s preferred inflation gauge of Core PCE. And then next week, at month open and Q2 open, we have the Non-farm Payrolls report on Friday.
For EUR/USD, there’s now a pattern of lower-lows and highs to work with and this highlights resistance potential above the current highs of 1.0800 at 1.0826, 1.0865 and then 1.0909 before the 1.0943 Fibonacci level comes back into play.
For support, the 1.0730-1.0750 zone is still fairly clear as the spot that bears would need to beat to continue the downside trend, and if they can do that, the next major level on the chart is the 1.0611 Fibonacci level.
EUR/USD Four-Hour Price Chart
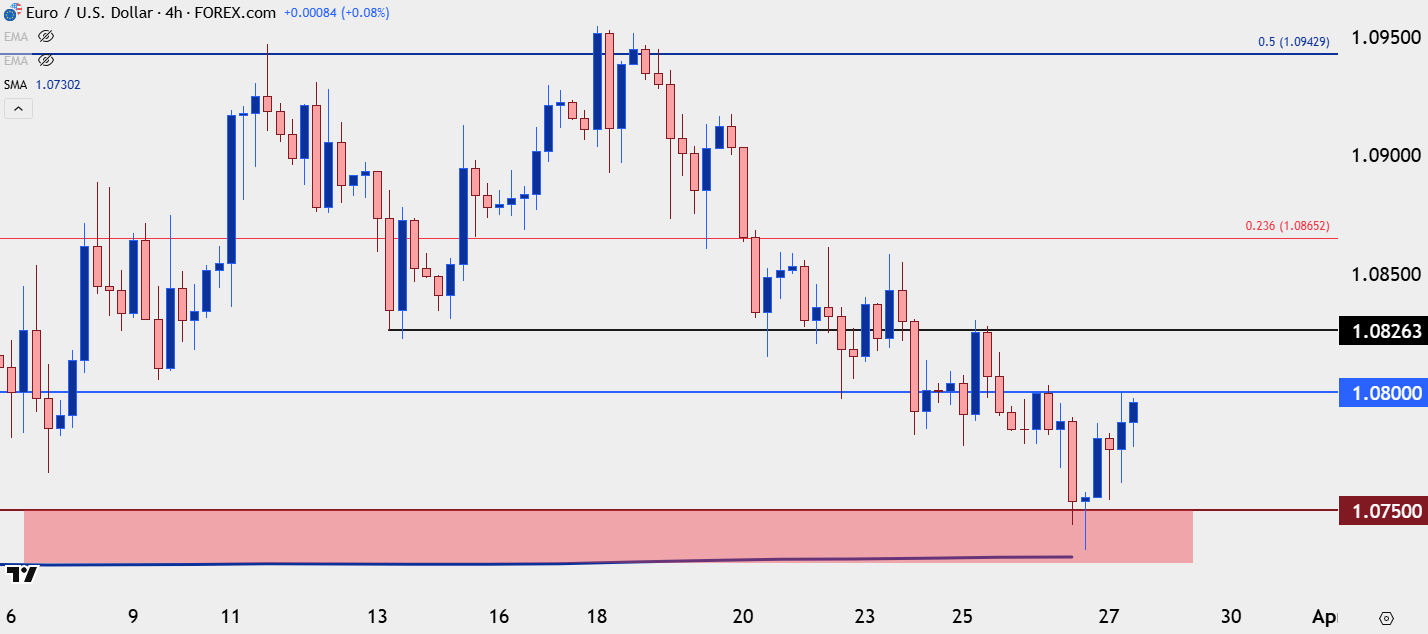 Chart prepared by James Stanley; data derived from Tradingview
--- written by James Stanley, Senior Strategist
EUR/USD, Euro Talking Points:
- It’s been a consistent sell-off for EUR/USD since the FOMC rate decision last week, with the pair printing six consecutive red daily candles.
- EUR/USD made a push into a key zone of support in late trade yesterday, and that’s so far brought a bounce. This doesn’t necessarily mean reversal of trend but it has allowed for a pullback to 1.0800, which sellers have so far responded to.
- EUR/USD and the U.S. Dollar are large focal points in each Tuesday webinar, and you’re welcome to join the next. Click here for registration information.
Trend can change quickly in the FX market, and we’ve seen that in the month of March in EUR/USD.
The pair started out the month with one of its strongest bullish breakouts ever, with a breach of the 1.0533 and 1.0600 resistance levels leading to strong topside moves. Buyers continued to push all the way into the 1.0943 Fibonacci level, which first came into play a couple weeks ago; and while bulls persisted for a little more than a week later, that same 1.0943 level refused to yield to breakout, and it was last Wednesday’s candle, around the FOMC rate decision, which sellers started to take over again.
Since then, it’s been an open pathway for bears. It hasn’t been an aggressive push as prices pulled back by about 200 pips over that time in a somewhat controlled manner.
This has all taken place in a very clean format, and I’ve looked at this in webinars over the past two weeks, with the pre-FOMC webinar highlighting a possible turn and then this Tuesday’s webinar highlighting the support test at the 1.0750 level which is confluent with the 200-day moving average. That spot came into play last night and is now leading into a bounce.
EUR/USD Daily Price Chart
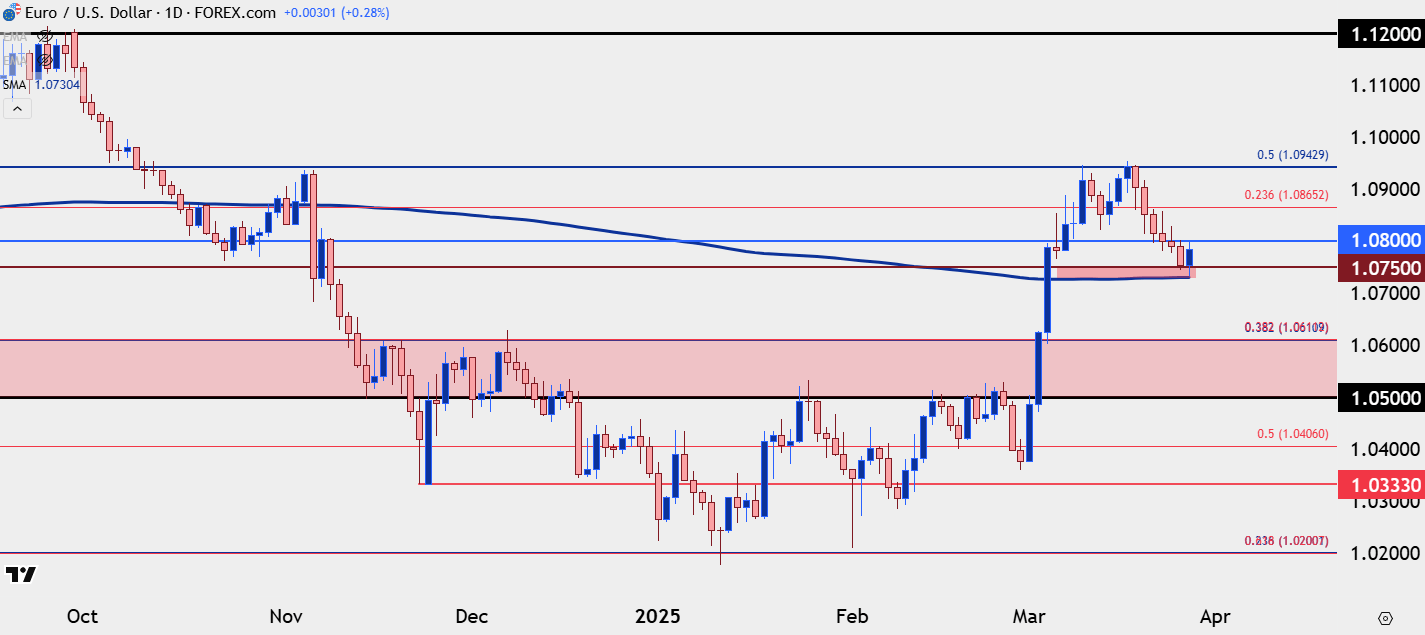 Chart prepared by James Stanley; data derived from Tradingview
EUR/USD Overbought Conditions Rectified
One of the more compelling items pointing to pullbacks a week ago was the RSI divergence that had built on the daily chart of EUR/USD; and the mirror image of that was an RSI divergence of oversold on the U.S. Dollar chart.
Both conditions have now been rectified after pullbacks in each market. The question now is one of continuation: Do we see the shorter-term bearish trend in EUR/USD continue down to fresh lows as more of the March move gets priced-out? Or do we see bulls respond to the pullback from the massive breakout that showed earlier in the month of March?
We’re nearing a spot on the economic calendar where some volatility in the US Dollar and related pairs can be expected. Tomorrow brings the Fed’s preferred inflation gauge of Core PCE. And then next week, at month open and Q2 open, we have the Non-farm Payrolls report on Friday.
For EUR/USD, there’s now a pattern of lower-lows and highs to work with and this highlights resistance potential above the current highs of 1.0800 at 1.0826, 1.0865 and then 1.0909 before the 1.0943 Fibonacci level comes back into play.
For support, the 1.0730-1.0750 zone is still fairly clear as the spot that bears would need to beat to continue the downside trend, and if they can do that, the next major level on the chart is the 1.0611 Fibonacci level.
EUR/USD Four-Hour Price Chart
Chart prepared by James Stanley; data derived from Tradingview
--- written by James Stanley, Senior Strategist
Related tags:



Open an account in minutes
Experience award-winning platforms with fast and secure execution, and enjoy tight spreads from 0.5 pts on FX and 0.3 pts on indices.
Economic calendar
Web Trader platform
Our sophisticated web-based platform is packed with features.
Related articles

Gold Does Something it Hasn’t Done in a Year, is Larger Risk-Off Afoot?
With tech stocks getting hit harder last week there was collateral damage elsewhere, including gold as the metal closed below the $4k level for the week and that’s the first time that’s happened to spot gold in more than a year.

US Dollar Price Action Setups: EUR/USD, USD/JPY, GBP/USD, USD/CAD
The Dollar is working on its second consecutive red week and while sellers didn’t exactly pounce on fresh lows, there’s an opening door for bears to make a move.

Silver forecast: metals liquidation drags XAG/USD into $50-55 support
Silver has broken its July low and slipped into a long-term support zone as the selling in precious metals deepens. The chart shows where the metal could bottom, and next week's Fed decision may decide whether it does.

This report is intended for general circulation only. It should not be construed as a recommendation, or an offer (or solicitation of an offer) to buy or sell any financial products. The information provided does not take into account your specific investment objectives, financial situation or particular needs. Before you act on any recommendation that may be contained in this report, independent advice ought to be sought from a financial adviser regarding the suitability of the investment product, taking into account your specific investment objectives, financial situation or particular needs.
StoneX Financial Pte. Ltd., may distribute reports produced by its respective foreign entities or affiliates within the StoneX group of companies or third parties pursuant to an arrangement under Regulation 32C of the Financial Advisers Regulations. Where the report is distributed to a person in Singapore who is not an accredited investor, expert investor or an institutional investor (as defined in the Securities Futures Act), StoneX Financial Pte. Ltd. accepts legal responsibility to such persons for the contents of the report only to the extent required by law. Singapore recipients should contact StoneX Financial Pte. Ltd. at 6826 9988 for matters arising from, or in connection with the report.
In the case of all other recipients of this report, to the extent permitted by applicable laws and regulations neither StoneX Financial Pte. Ltd. nor its associated companies will be responsible or liable for any loss or damage incurred arising out of, or in connection with, any use of the information contained in this report and all such liability is hereby expressly disclaimed. No representation or warranty is made, express or implied, that the content of this report is complete or accurate.
StoneX Financial Pte. Ltd. is not under any obligation to update this report.
Trading CFDs carries a high level of risk that may not be suitable for some investors. Consider your investment objectives, level of experience, financial resources, risk appetite and other relevant circumstances carefully. The possibility exists that you could lose some or all of your investments, including your initial deposits. If in doubt, please seek independent expert advice. Visit www.forex.com/en-sg/terms-and-policies for the complete Risk Disclosure Statement.