



FOMC + BOE could send GBP/USD spiraling
GBP/USD is already down roughly 400 pips from Thursday’s high. Can it move lower? With a hawkish FOMC and a dovish BOE, it sure seems possible.
Share this:

The FOMC statement was seen as dovish as a result of the wording that “in determining the pace of rate hikes, we will consider cumulative tightening, policy lags, and economic and financial developments”. However, the markets reversed quickly during the hawkish Powell press conference that followed as he noted that:
- Incoming data suggests that the ultimate level of rates will be higher than previously anticipated
- Pausing rate hikes is not something we are thinking about or even discussing
And with that, US stock indices moved lower, while US yields and the US Dollar moved higher.
For a complete recap of the FOMC meeting, click here.
The Bank of England painted a completely different picture for the British economy and the meeting was taken as dovish. The Bank of England statement noted that it sees a 2-year recession if rates follow the market curve. In addition, the statement said that peak interest rates will likely be lower than implied by the markets. The committee did lower its inflation forecasts. However, BOE Governor Bailey said “that the MPC judges that risks to inflation projections are to the upside.
As a result of the BOE meeting, the FTSE 100 moved higher, while the Pound moved lower.
For a complete recap of the BOE meeting, click here.
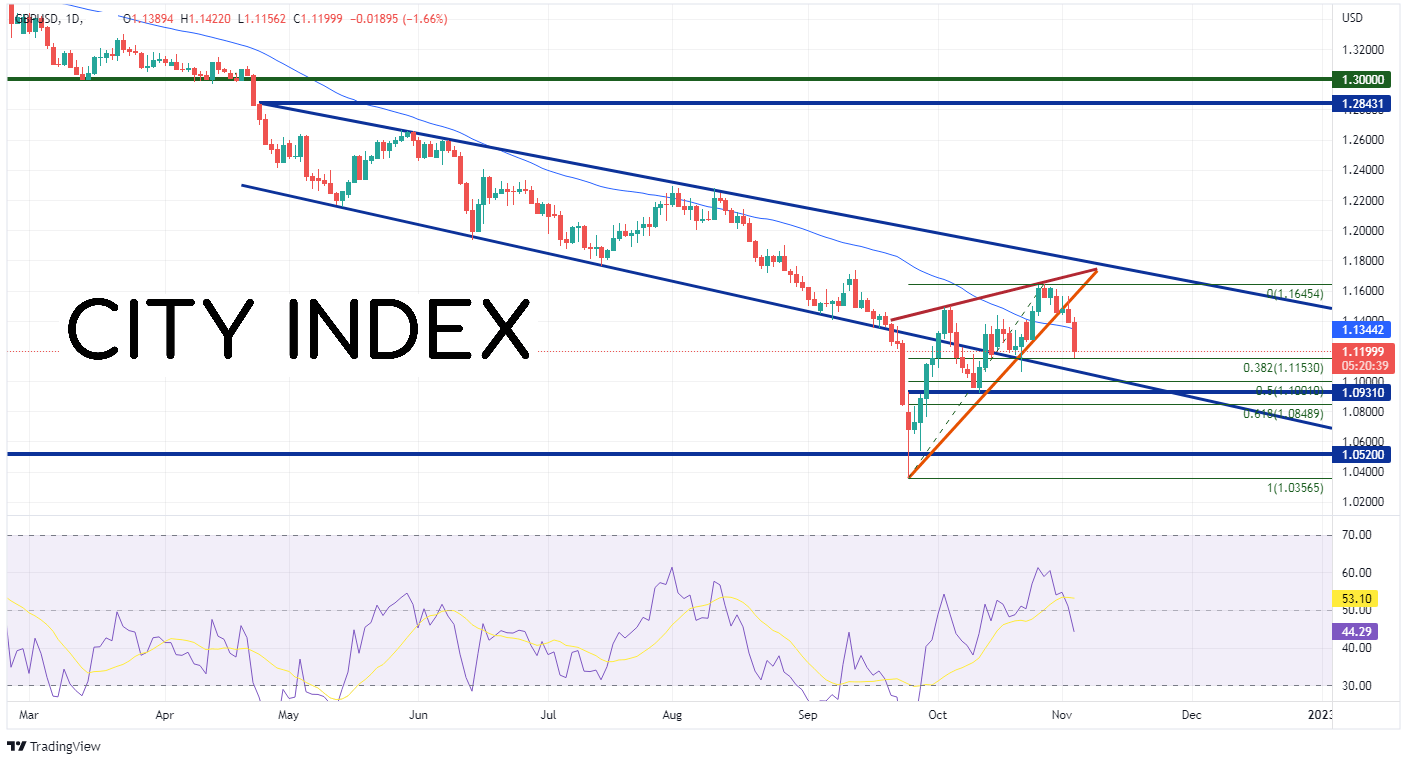
As a result of opposite views of their respective economies by the Fed and the BOE, GBP/USD has moved aggressively lower. GBP/USD broke below 1.3000 on April 22nd and has been moving lower in an orderly channel. However, on September 21st, the pair broke below the bottom trendline of the channel near 1.1350 and sold off to a low of 1.0357 on September 26th. After the BOE bought Gilts in the market to save the economy, GBP/USD moved higher, back into the channel, in an ascending wedge formation to a high of 1.1645. However, the pair broke down below the wedge yesterday, as the hawkish FOMC led to a bid in the US Dollar. After the dovish BOE meeting, the pair continued lower through the 50 Day Moving Average and found support at the 38.2% Fibonacci retracement level from the lows of September 26th to the highs of October 27th, near 1.1153.

Source: Tradingview, Stone X
If GBP/USD does continue to move below the 38.2% Fibonacci retracement level, the next level of support is the bottom trendline of the longer-term channel near 1.0775, then the 50% retracement level from the above-mentioned timeframe near 1.1001. Below there is horizontal support dating to September 26th at 1.0931. However, notice that the RSI is in oversold territory on the 240-minute timeframe and turning higher. This indicates that the pair may correct before resuming its downward trend. The first level of resistance is at the November 2nd highs and the bottom trendline of the ascending wedge near 1.1386. Above there, price can move to the highs from October 27th at 1.1645 then the top trendline of the wedge at 1.1715.

Source: Tradingview, Stone X
GBP/USD is already down roughly 400 pips from Thursday’s high. Can it move lower? With a hawkish FOMC and a dovish BOE, it sure seems possible. Near-term, watch Friday’s Non-Farm Payroll print. If the print is weaker than the expectation of +200,000, traders could sell the US Dollar and buy stocks (bad news is good), as it would mean the Fed now has to worry about a slower jobs market when making a rate hike decision at its next interest rate meeting.
The FOMC statement was seen as dovish as a result of the wording that “in determining the pace of rate hikes, we will consider cumulative tightening, policy lags, and economic and financial developments”. However, the markets reversed quickly during the hawkish Powell press conference that followed as he noted that:
- Incoming data suggests that the ultimate level of rates will be higher than previously anticipated
- Pausing rate hikes is not something we are thinking about or even discussing
And with that, US stock indices moved lower, while US yields and the US Dollar moved higher.
For a complete recap of the FOMC meeting, click here.
The Bank of England painted a completely different picture for the British economy and the meeting was taken as dovish. The Bank of England statement noted that it sees a 2-year recession if rates follow the market curve. In addition, the statement said that peak interest rates will likely be lower than implied by the markets. The committee did lower its inflation forecasts. However, BOE Governor Bailey said “that the MPC judges that risks to inflation projections are to the upside.
As a result of the BOE meeting, the FTSE 100 moved higher, while the Pound moved lower.
For a complete recap of the BOE meeting, click here.
As a result of opposite views of their respective economies by the Fed and the BOE, GBP/USD has moved aggressively lower. GBP/USD broke below 1.3000 on April 22nd and has been moving lower in an orderly channel. However, on September 21st, the pair broke below the bottom trendline of the channel near 1.1350 and sold off to a low of 1.0357 on September 26th. After the BOE bought Gilts in the market to save the economy, GBP/USD moved higher, back into the channel, in an ascending wedge formation to a high of 1.1645. However, the pair broke down below the wedge yesterday, as the hawkish FOMC led to a bid in the US Dollar. After the dovish BOE meeting, the pair continued lower through the 50 Day Moving Average and found support at the 38.2% Fibonacci retracement level from the lows of September 26th to the highs of October 27th, near 1.1153.
Source: Tradingview, Stone X
Trade GBP/USD now: Login or Open a new account!
• Open an account in the UK
• Open an account in Australia
• Open an account in Singapore
If GBP/USD does continue to move below the 38.2% Fibonacci retracement level, the next level of support is the bottom trendline of the longer-term channel near 1.0775, then the 50% retracement level from the above-mentioned timeframe near 1.1001. Below there is horizontal support dating to September 26th at 1.0931. However, notice that the RSI is in oversold territory on the 240-minute timeframe and turning higher. This indicates that the pair may correct before resuming its downward trend. The first level of resistance is at the November 2nd highs and the bottom trendline of the ascending wedge near 1.1386. Above there, price can move to the highs from October 27th at 1.1645 then the top trendline of the wedge at 1.1715.

Source: Tradingview, Stone X
GBP/USD is already down roughly 400 pips from Thursday’s high. Can it move lower? With a hawkish FOMC and a dovish BOE, it sure seems possible. Near-term, watch Friday’s Non-Farm Payroll print. If the print is weaker than the expectation of +200,000, traders could sell the US Dollar and buy stocks (bad news is good), as it would mean the Fed now has to worry about a slower jobs market when making a rate hike decision at its next interest rate meeting.
Learn more about forex trading opportunities.
Related tags:


Open an account in minutes
Experience award-winning platforms with fast and secure execution, and enjoy tight spreads from 0.5 pts on FX and 0.3 pts on indices.
Economic calendar
Web Trader platform
Our sophisticated web-based platform is packed with features.
Related articles
NFP Preview: Can the Jobs Report Overcome the Bond Market Meltdown Too?
Traders and economists expect the NFP report to show that the US created 90K net new jobs, with average hourly earnings rising 0.3% m/m (3.1% y/y) and the U3 unemployment rate at 4.1% - see what the leading indicators are suggesting!

US Dollar Technical Outlook: DXY Bulls Meet Resistance at Yearly Highs 10 1 2026
The U.S. Dollar has held firm despite fading Fed hike bets, but Friday’s payrolls could test the rally’s staying power.


Dow Jones forecast: Stock markets under pressure from multiple sources
When looking at the major tech-heavy US indices like the S&P 500 or the Nasdaq 100, you wouldn’t think that the stock market is particularly weak. Yet, beneath the surface, the market is far from healthy right now. Investors are evidently just piling into the big tech and AI names, and as a result, market breadth is deteriorating. Other indices like the small cap Russell 2000 and the Dow Jones are starting to reflect that weakness.

This report is intended for general circulation only. It should not be construed as a recommendation, or an offer (or solicitation of an offer) to buy or sell any financial products. The information provided does not take into account your specific investment objectives, financial situation or particular needs. Before you act on any recommendation that may be contained in this report, independent advice ought to be sought from a financial adviser regarding the suitability of the investment product, taking into account your specific investment objectives, financial situation or particular needs.
StoneX Financial Pte. Ltd., may distribute reports produced by its respective foreign entities or affiliates within the StoneX group of companies or third parties pursuant to an arrangement under Regulation 32C of the Financial Advisers Regulations. Where the report is distributed to a person in Singapore who is not an accredited investor, expert investor or an institutional investor (as defined in the Securities Futures Act), StoneX Financial Pte. Ltd. accepts legal responsibility to such persons for the contents of the report only to the extent required by law. Singapore recipients should contact StoneX Financial Pte. Ltd. at 6826 9988 for matters arising from, or in connection with the report.
In the case of all other recipients of this report, to the extent permitted by applicable laws and regulations neither StoneX Financial Pte. Ltd. nor its associated companies will be responsible or liable for any loss or damage incurred arising out of, or in connection with, any use of the information contained in this report and all such liability is hereby expressly disclaimed. No representation or warranty is made, express or implied, that the content of this report is complete or accurate.
StoneX Financial Pte. Ltd. is not under any obligation to update this report.
Trading CFDs carries a high level of risk that may not be suitable for some investors. Consider your investment objectives, level of experience, financial resources, risk appetite and other relevant circumstances carefully. The possibility exists that you could lose some or all of your investments, including your initial deposits. If in doubt, please seek independent expert advice. Visit www.forex.com/en-sg/terms-and-policies for the complete Risk Disclosure Statement.