



GBP/USD, GBP/JPY, GBP/AUD: Sterling Eyes UK Inflation Catalyst
Sterling faces a pivotal UK inflation test as traders weigh BoE tightening, Fed minutes and Australian employment data across GBP/USD, GBP/JPY and GBP/AUD.
Share this:

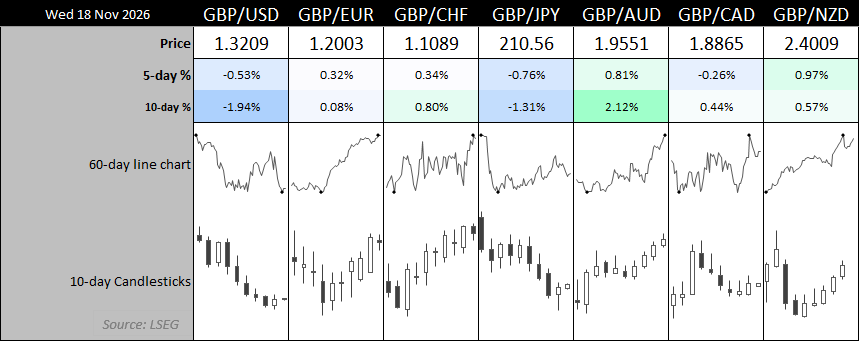
Sterling faces several potential catalysts over the next 24 hours, with UK inflation, FOMC minutes and Australian employment figures likely to influence GBP/USD, GBP/JPY and GBP/AUD.
The US dollar's extended rally has lost some momentum following mixed retail sales and import-price figures, potentially opening the door for a GBP/USD recovery. Meanwhile, disappointing Japanese GDP has raised questions about the timing of the Bank of Japan's next rate hike, while Australian employment figures could provide another catalyst for GBP/AUD.
Yet with markets already pricing further Bank of England (BoE) tightening, today's UK inflation report could prove pivotal in determining whether sterling can capitalise on these developments.
View related analysis:
UK Inflation Takes Centre Stage as Sterling Faces Multiple Catalysts
BoE Rate Expectations Remain Elevated Despite Softer UK Wages
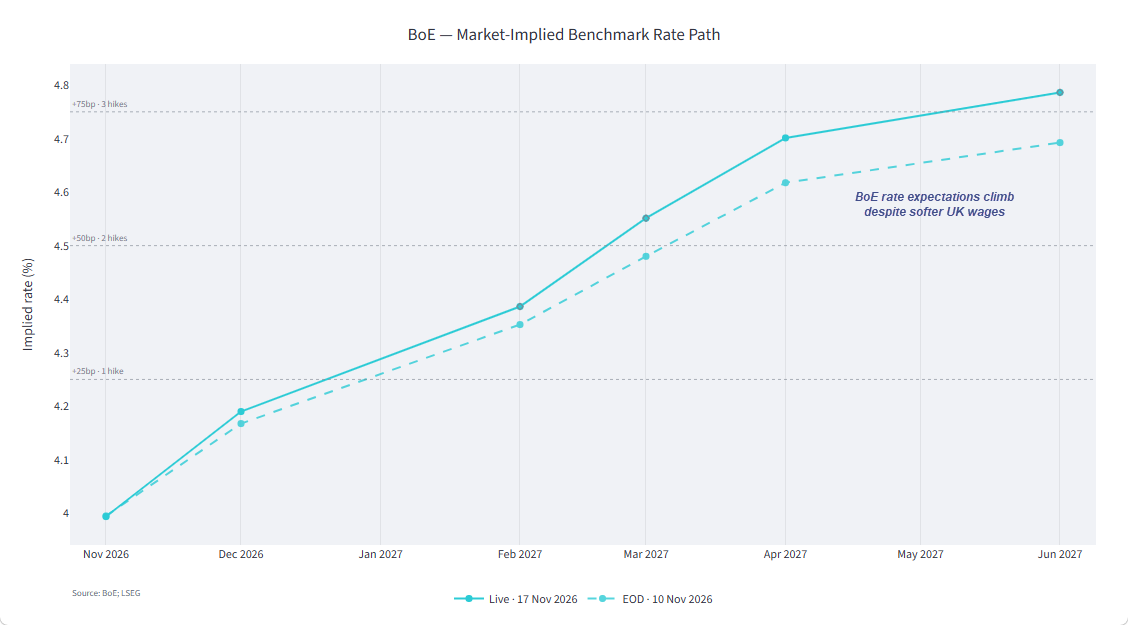
The BoE raised interest rates by 25 basis points to 4% in November, with eight Monetary Policy Committee members supporting the increase and one favouring a larger 50bp move.
Markets continue to anticipate further tightening, with roughly 90% odds of another 25bp increase in December. The SONIA curve has shifted higher since 10 November, particularly across early-to-mid 2027, with market-implied rates rising by as much as 8bp by June. Markets now imply Bank Rate approaching 4.8% by mid-2027.
However, Tuesday's employment report presented a mixed picture. Regular wage growth slowed to 3.5% from 3.7%, while private-sector wage growth stood at 3.1%. Job vacancies fell to 690,000, their lowest since April 2021, although unemployment unexpectedly declined to 4.6% from 4.7%.
The slowdown in wages and hiring suggests some easing in domestic inflation pressures, but the BoE remains concerned that elevated energy costs could become embedded in broader prices and wage negotiations.
UK Inflation Turns Higher as BoE Faces Further Tightening Pressure
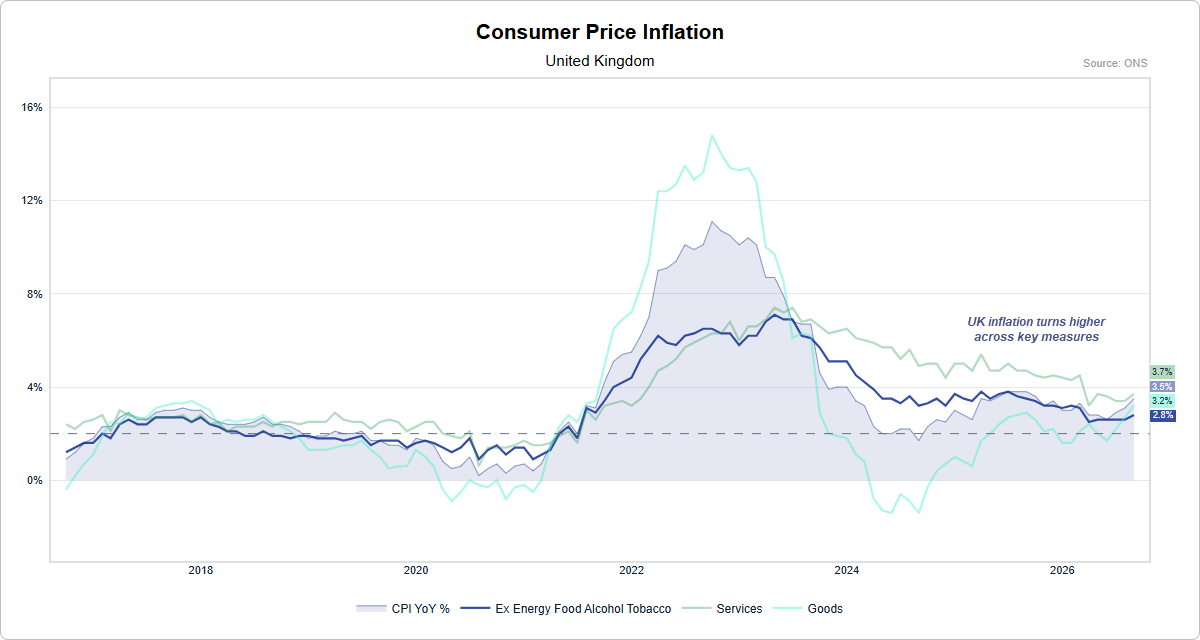
Meanwhile, UK inflation has started to turn higher across several measures. Headline CPI stands at 3.5%, with services inflation at 3.7%, goods inflation at 3.2% and core CPI at 2.8%. This broadening of price pressures reinforces the BoE's dilemma, as inflation remains above target despite evidence of a cooling labour market.
Today's October CPI report will therefore be critical in determining whether markets maintain their expectations for further tightening. A hotter inflation print could reinforce December hike expectations and support sterling, while softer figures could challenge the extent of additional increases priced throughout 2027.
Sterling Technical Analysis: GBP/USD, GBP/JPY and GBP/AUD
GBP/USD Technical Analysis: Bullish Divergence Hints at Sterling Bounce
With momentum behind the US dollar rally waning, there could be scope for some technical repositioning across FX majors in the near term. This could favour GBP/USD, particularly if UK inflation surprises even modestly to the upside.
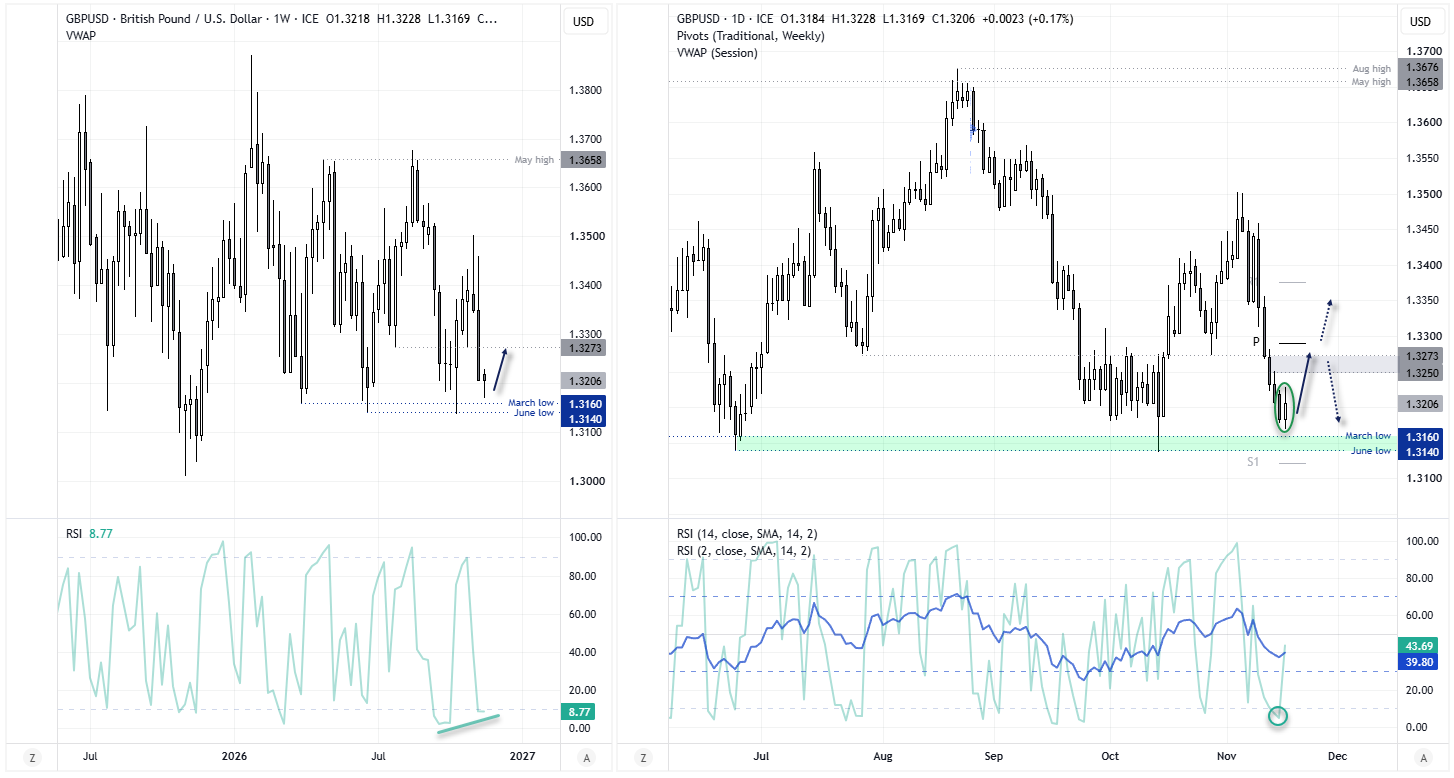
The weekly chart shows that the current candle's range remains exceptionally narrow, suggesting a lack of enthusiasm among bears. Also note the bullish divergence forming on the weekly RSI (2) within oversold territory.
On the daily chart, a bullish outside candle snapped a five-day losing streak, hinting at a potential swing low. The fact that it formed above the March and June lows, while GBP/USD attempts to reclaim 1.3200, adds weight to the near-term bullish case.
Incoming economic data will ultimately determine whether a recovery materialises and how far it might extend. The 1.3273 level is an initial pivot to watch, with the weekly pivot point sitting just beneath 1.3300. A sustained break above these levels could open the door towards 1.3350, while the March and June lows around 1.3140–1.3160 remain an important support zone.
Source: ICE, TradingView

GBP/JPY Technical Analysis: Bullish Hammer Hints at Short-Term Recovery
I also see the potential for a swing low on GBP/JPY. A small bullish hammer formed on Tuesday near the April low, closing back above the 210 handle and weekly S1 pivot. This has pulled the daily RSI (2) out of oversold territory, adding weight to the possibility of a near-term recovery.
That said, the weekly chart presents conflicting signals, suggesting any bounce could be limited. A shooting star formed two weeks ago, followed by an inverted hammer. The weekly RSI (2) remains below 50, indicating negative momentum, but is not yet oversold enough to suggest an imminent swing low on this timeframe.
Bulls may therefore favour minor pullbacks within Tuesday's range to improve the potential reward-to-risk ratio for a short-term bounce. The weekly pivot point around 211 offers an initial upside target, although a sustained recovery would likely require a break above nearby resistance.
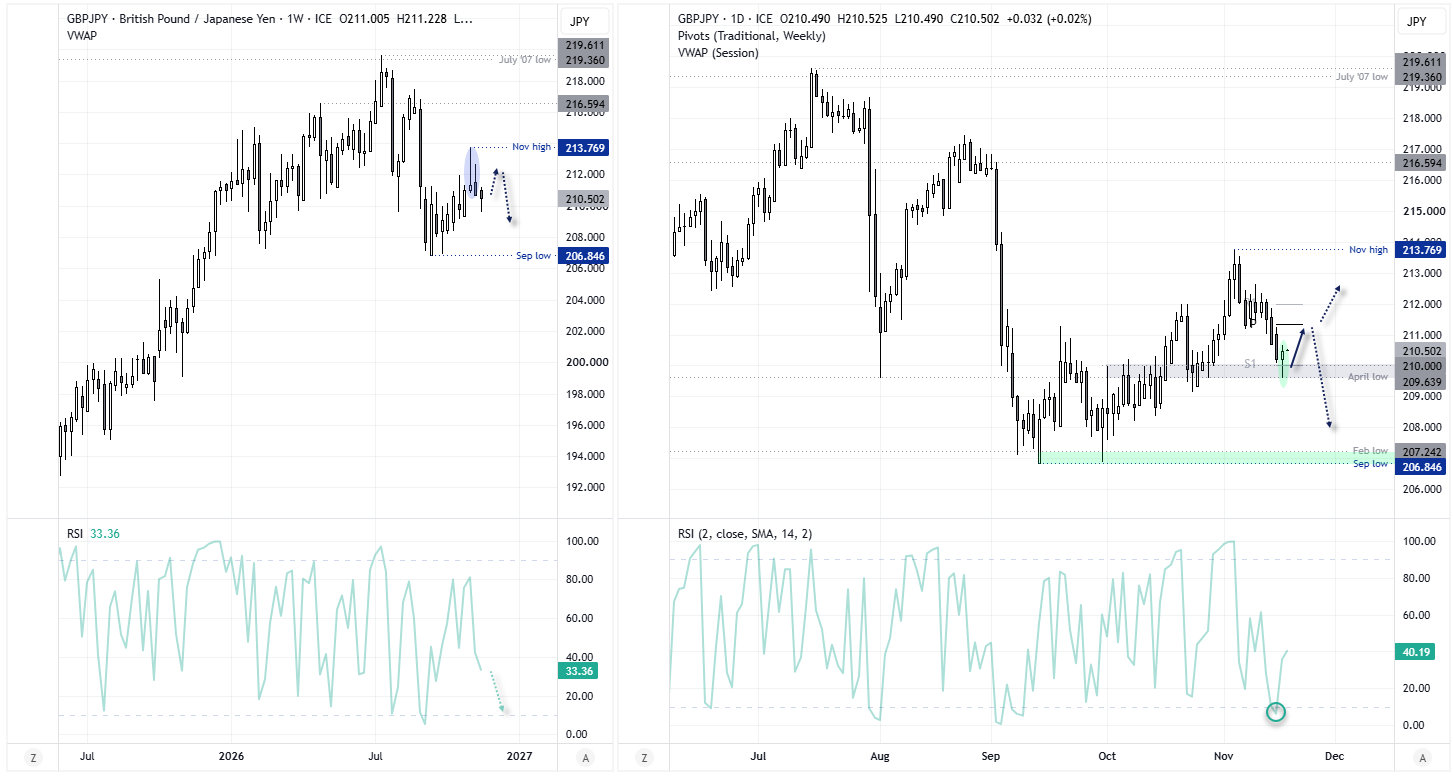
Source: ICE, TradingView
GBP/AUD Technical Analysis: Bullish Reversal Targets 1.98, but Rally Looks Stretched
This is more of an update than a fresh idea, but it is encouraging to see the bullish reversal on the GBP/AUD play out well so far. An inverted head and shoulders pattern projects an upside target near 2.030, though the November low at 1.9960 makes a viable target for bulls given it sits just above the 2.0. However, the weekly RSI (2) is currently overbought, and the rally is stalled around the January low and monthly R3 pivot point for now.
The fact GBP/AUD has reached the R4 by the 18th of the month could be deemed a form of overbought indicator over the near term. Not that there are imminent signs of a top. The daily chart shows a strong rally out of a bull flag, so I suspect any dips from here could be shallow and bulls are eyeing a move to 1.97 or 1.98, near the monthly R4 pivot.
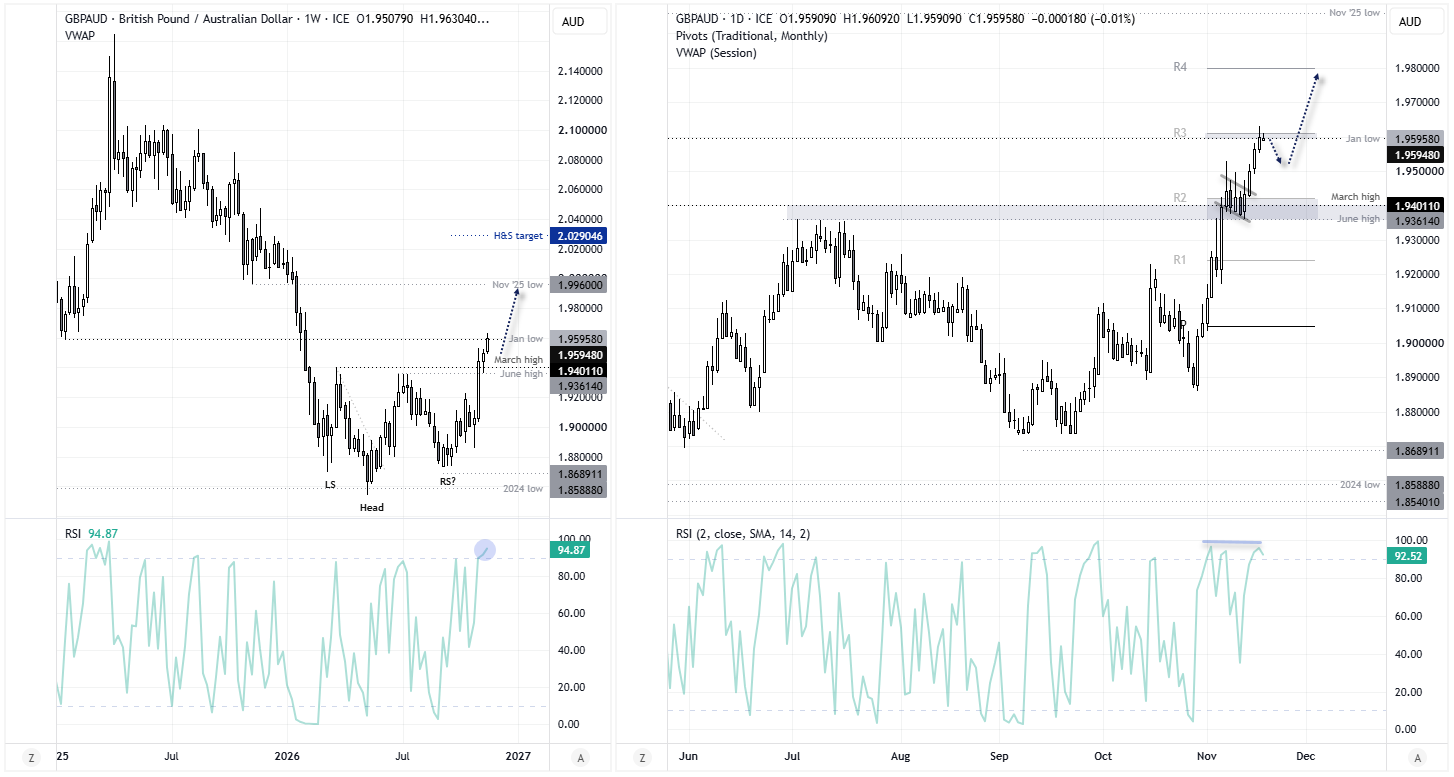
Source: ICE, TradingView


Open an account in minutes
Experience award-winning platforms with fast and secure execution, and enjoy tight spreads from 0.5 pts on FX and 0.3 pts on indices.
Economic calendar
Web Trader platform
Our sophisticated web-based platform is packed with features.
Related articles
Gold, GBP/USD Forecast: Two trades to watch
Gold tumbles to a fresh 14-month low on hawkish Fed rhetoric. GBP/USD falls to a yearly low on USD strength and after cooler-than-forecast UK inflation data.

Rates Shock, Metals Rout Leave Aussie Dollar Under the Pump
The global environment is becoming increasingly hostile for the Aussie. With AUD/USD breaking major support and AUD/JPY threatening further downside, today's jobs report faces an uphill battle to change the picture.


Gold's Rout Accelerates as FOMC Minutes Bolster the US Doller
Gold extends its selloff as hawkish FOMC minutes reinforce Fed rate hike expectations, lifting the US dollar and pressuring gold prices across major currencies.
This report is intended for general circulation only. It should not be construed as a recommendation, or an offer (or solicitation of an offer) to buy or sell any financial products. The information provided does not take into account your specific investment objectives, financial situation or particular needs. Before you act on any recommendation that may be contained in this report, independent advice ought to be sought from a financial adviser regarding the suitability of the investment product, taking into account your specific investment objectives, financial situation or particular needs.
StoneX Financial Pte. Ltd., may distribute reports produced by its respective foreign entities or affiliates within the StoneX group of companies or third parties pursuant to an arrangement under Regulation 32C of the Financial Advisers Regulations. Where the report is distributed to a person in Singapore who is not an accredited investor, expert investor or an institutional investor (as defined in the Securities Futures Act), StoneX Financial Pte. Ltd. accepts legal responsibility to such persons for the contents of the report only to the extent required by law. Singapore recipients should contact StoneX Financial Pte. Ltd. at 6826 9988 for matters arising from, or in connection with the report.
In the case of all other recipients of this report, to the extent permitted by applicable laws and regulations neither StoneX Financial Pte. Ltd. nor its associated companies will be responsible or liable for any loss or damage incurred arising out of, or in connection with, any use of the information contained in this report and all such liability is hereby expressly disclaimed. No representation or warranty is made, express or implied, that the content of this report is complete or accurate.
StoneX Financial Pte. Ltd. is not under any obligation to update this report.
Trading CFDs carries a high level of risk that may not be suitable for some investors. Consider your investment objectives, level of experience, financial resources, risk appetite and other relevant circumstances carefully. The possibility exists that you could lose some or all of your investments, including your initial deposits. If in doubt, please seek independent expert advice. Visit www.forex.com/en-sg/terms-and-policies for the complete Risk Disclosure Statement.