



GBPUSD, Silver Price Outlook: Will the Pound Hold 1.33 Support and Silver 65?
GBPUSD tests the critical 1.33 support zone while silver challenges 65 amid shifting geopolitical sentiment. Explore key support levels, resistance zones, and bullish and bearish scenarios.
Share this:

The British pound is testing the critical 1.33 support zone, while silver continues to challenge the 65 level after markets experienced a brief risk-on reaction following news of a completed peace deal. However, uncertainty persists, and the key technical scenarios remain unchanged.
Recent market moves have reflected the usual contrast between optimistic claims from Trump and uncertainty surrounding Iran's response. This backdrop triggered a momentum rebound across several assets that had recently experienced sharp declines, including precious metals, currencies, and US equity indices.
The broader narrative remains tied to questions surrounding Iran's nuclear capabilities, one of the core drivers behind the conflict. Market sentiment is leaning towards an optimistic hold, with crude oil's decline back below its multi-month consolidation range, trading near $82 per barrel.
I discussed the importance of this crude oil pattern and its implications for the broader market narrative during my daily MENA Market Call webinar.
Register here to follow the analysis live: register.gotowebinar.com/#register/1712903232130037596
Markets Continue to Face Key Resistance Levels
The ongoing trigger-and-response dynamic between the United States and Iran is also reflected on the charts, where attempted reversals continue to encounter significant resistance levels.
- Gold rebounded more than 200 points from the 4,020 low before pulling back from resistance near 4,240.
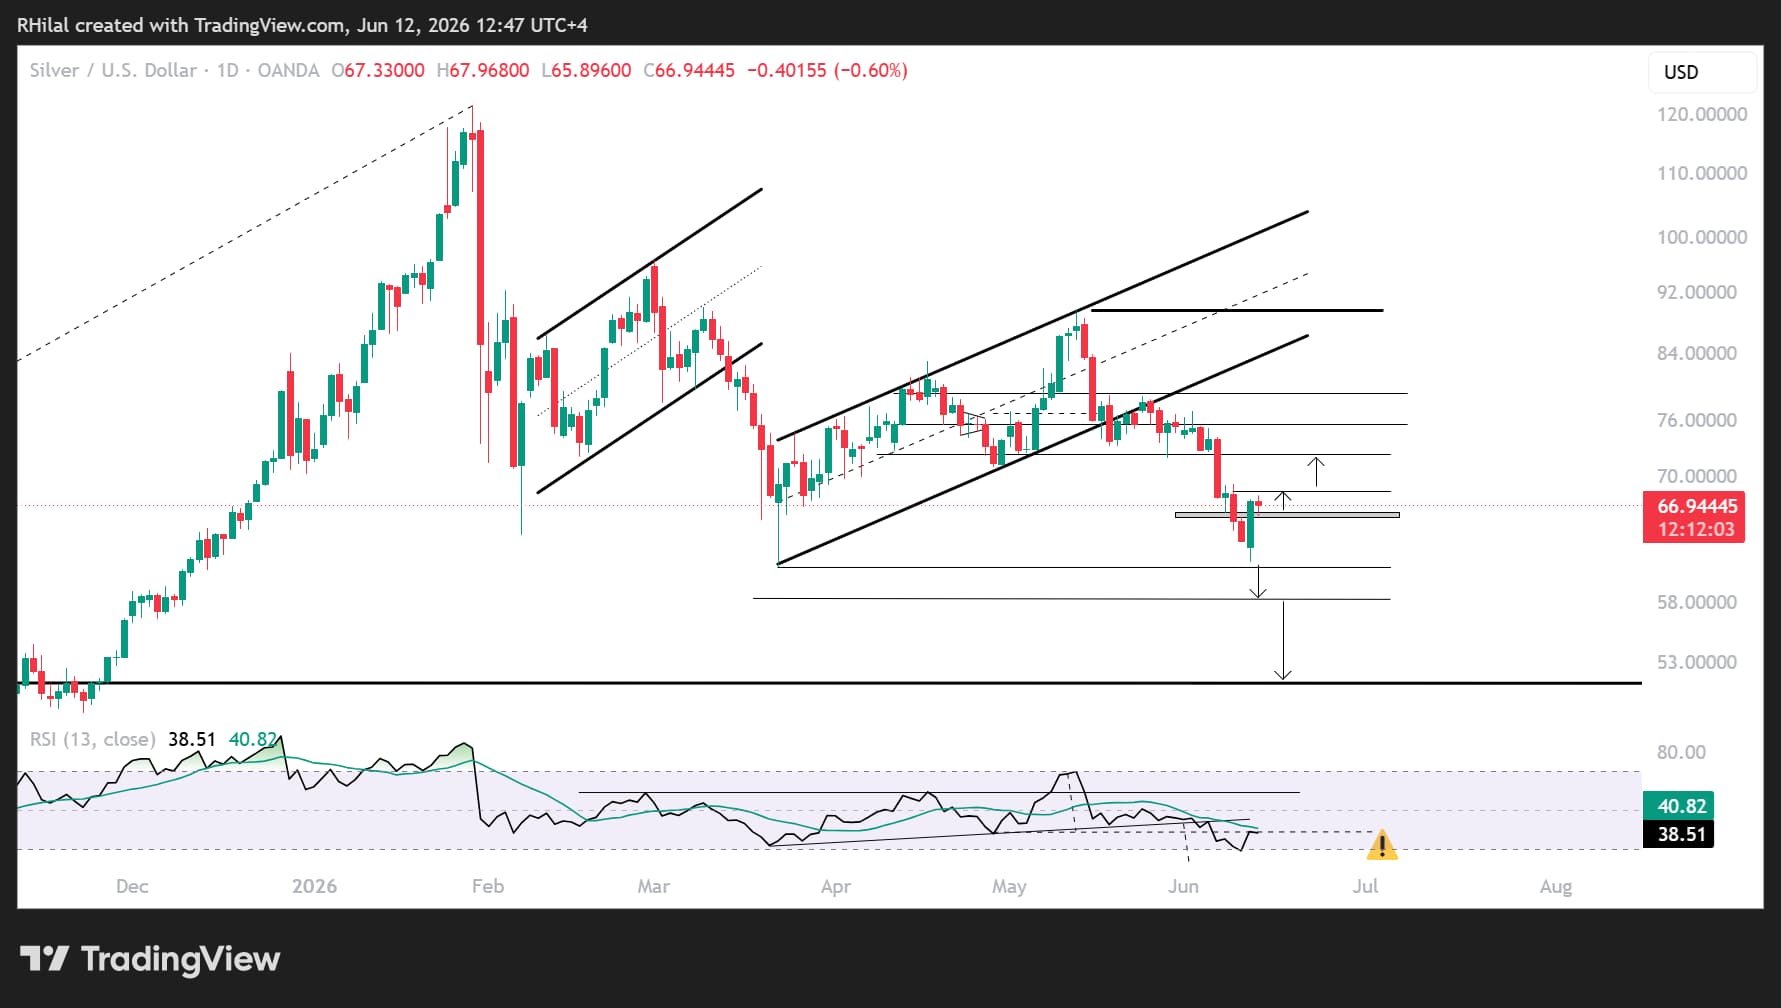
- Silver rebounded more than 600 points from the 61.40 low before stalling near the 68 resistance zone.
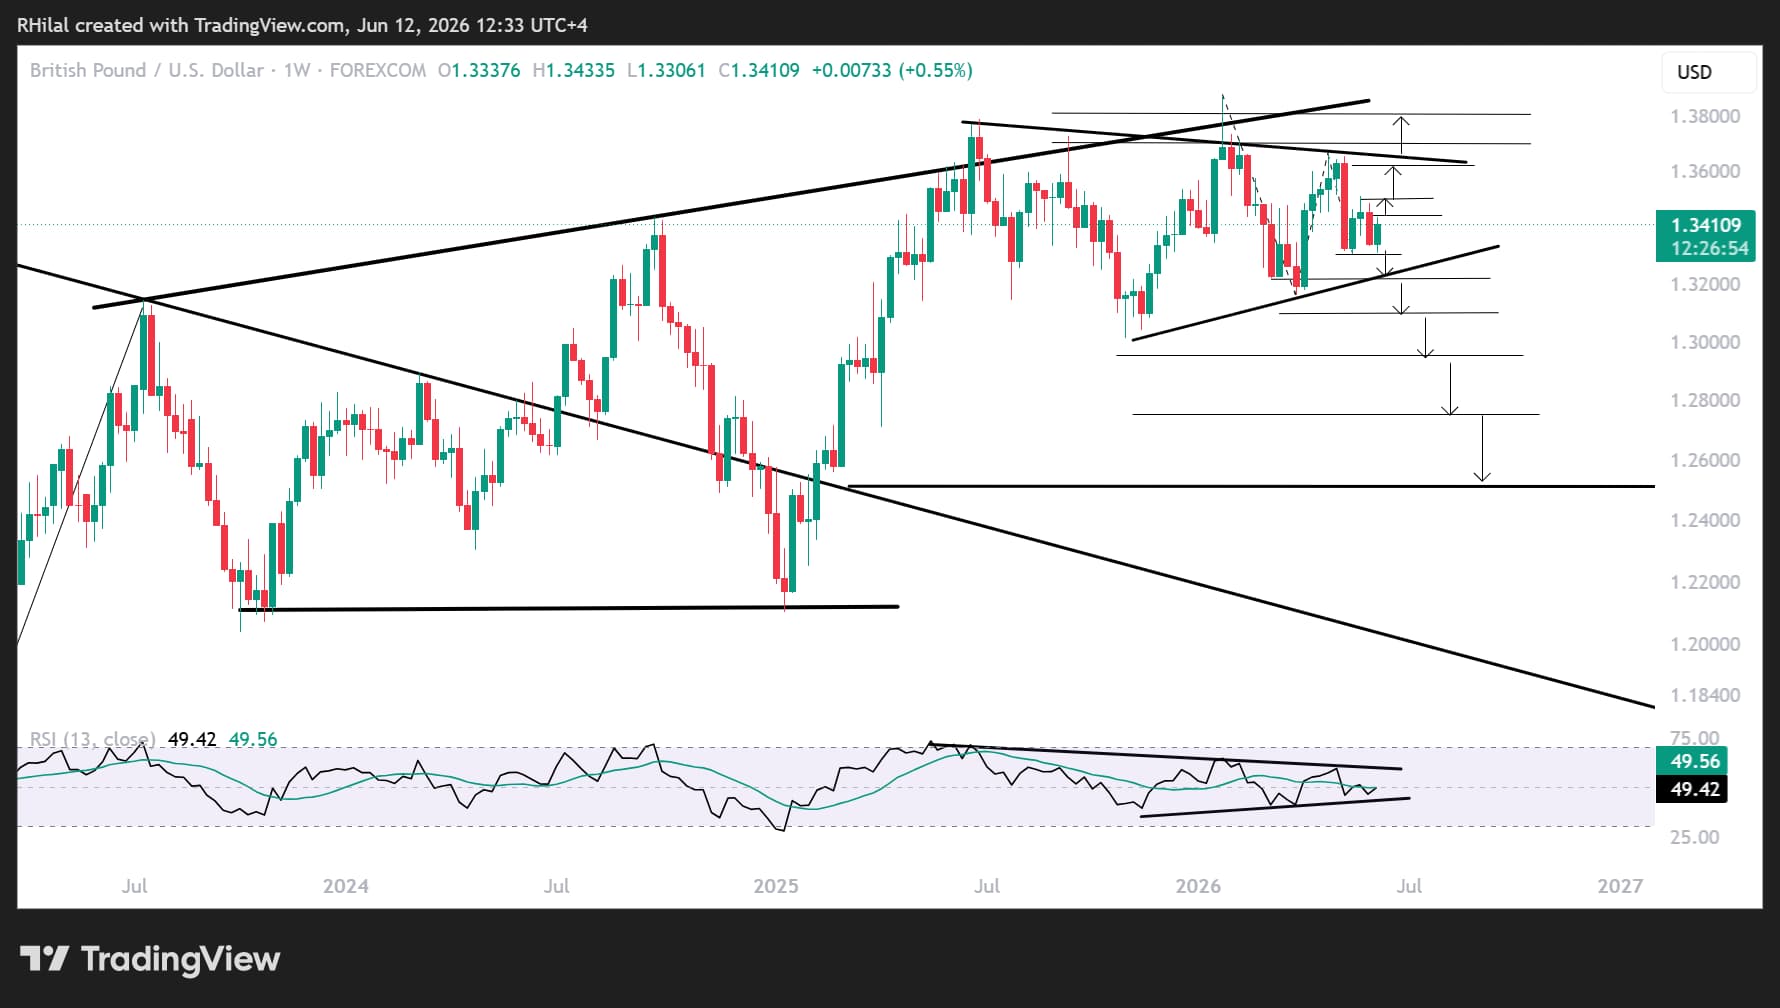
- GBPUSD rebounded more than 100 pips from 1.3320 before pulling back from resistance near 1.3430.
- Nasdaq rebounded more than 1,000 points from 28,600 before encountering resistance around 29,620.
GBPUSD Price Outlook: Weekly Time Frame – Log Scale
Source: TradingView
Broader Technical Framework
GBPUSD remains within a one-year contracting consolidation pattern, which itself sits within a broader consolidation structure that has been developing since 2023. The pair continues to trade below the major resistance zone near 1.38.
Current Support Remains at 1.3320
The 1.3320 level aligns with the 0.618 Fibonacci extension of the January–March–April 2026 cycle and continues to provide an important support zone for a potential rebound.
Key Resistance Levels
The immediate resistance zone is located between 1.3420 and 1.3500, aligning with the 0.382 Fibonacci extension of the March–May 2026 cycle.
Bullish Scenario
A sustained breakout above the 1.3420–1.3500 resistance zone would expose the upper boundary of the consolidation pattern and the next Fibonacci extension levels.
The next upside targets would emerge near:
- 1.3620 - 61.8%
- 1.3700 - 78.6%
- 1.3800 - 100%
A confirmed breakout above 1.38 would strengthen the long-term bullish outlook and expose the major historical highs near:
- 1.4250 - 2021 high
- 1.4320 - 2018 high
Bearish Scenario
A sustained move below 1.3320 would expose the year's ascending support trendline near 1.3200.
This area may provide another rebound opportunity. However, a confirmed breakdown would shift focus toward:
- 1.3100
- 1.2950
- 1.2750
- 1.2500
The 1.2500 level aligns with the 1.618 Fibonacci extension and may offer another attractive long-term bullish positioning opportunity.
Silver Price Outlook: Daily Time Frame – Log Scale
Source: TradingView
Broader Technical Framework
Silver is attempting to recover from the yearly lows near 61. However, price action remains within bearish territory while trading below the key 68–72 resistance zone.
Current Support Zone
The primary support remains at 61, which corresponds to the 2026 low and the 78.6% Fibonacci extension of the March–May cycle.
Current Resistance Zone
The immediate resistance area is located between 68 and 72, aligning with the 0.272 and 0.382 Fibonacci extensions of the March–May–June 2026 cycle.
Bullish Scenario
A sustained breakout above the 68–72 resistance zone would strengthen bullish momentum and expose the following upside targets:
- 72.40
- 75.70
- 79.00 - 61.8%
These levels align with the extension of the March low–May high–June low cycle.
A confirmed breakout beyond these levels would reopen the path toward the 90 region and potentially triple-digit silver prices over the longer term.
Bearish Scenario
A sustained hold below 65.80, followed by a break beneath 63.00, would increase the risk of another retest of the yearly lows.
A confirmed breakdown would expose the next major support levels near:
- 58
- 51
- 48
These levels align with the multi-decade resistance zone that dates back to the 1980s and could potentially transform into long-term support, creating another attractive bullish positioning opportunity.
Written by Razan Hilal, CMT
Follow on X: @Rh_waves


Open an account in minutes
Experience award-winning platforms with fast and secure execution, and enjoy tight spreads from 0.5 pts on FX and 0.3 pts on indices.
Economic calendar
Web Trader platform
Our sophisticated web-based platform is packed with features.
Related articles
USD/CAD shooting star puts September surge on notice
USD/CAD has printed a clear bearish reversal pattern after an extraordinary September surge, but confirmation may depend heavily on how US Treasury yields react to Friday’s payrolls report.

USD/CHF Reverses as Swiss Franc Surges amid Bond Carnage
USD/CHF reverses from channel resistance as bond volatility surges and broad Swiss franc strength points to a possible carry-trade unwind.


USD/MXN Analysis: Is Super Peso Starting to Fade?
Over recent trading sessions, the Mexican peso has continued to show signs of weakness against the U.S. dollar. This can already be seen in USD/MXN, which has gained more than 1.7% over the last three sessions, highlighting sustained buying pressure in favor of the dollar in the short term.

This report is intended for general circulation only. It should not be construed as a recommendation, or an offer (or solicitation of an offer) to buy or sell any financial products. The information provided does not take into account your specific investment objectives, financial situation or particular needs. Before you act on any recommendation that may be contained in this report, independent advice ought to be sought from a financial adviser regarding the suitability of the investment product, taking into account your specific investment objectives, financial situation or particular needs.
StoneX Financial Pte. Ltd., may distribute reports produced by its respective foreign entities or affiliates within the StoneX group of companies or third parties pursuant to an arrangement under Regulation 32C of the Financial Advisers Regulations. Where the report is distributed to a person in Singapore who is not an accredited investor, expert investor or an institutional investor (as defined in the Securities Futures Act), StoneX Financial Pte. Ltd. accepts legal responsibility to such persons for the contents of the report only to the extent required by law. Singapore recipients should contact StoneX Financial Pte. Ltd. at 6826 9988 for matters arising from, or in connection with the report.
In the case of all other recipients of this report, to the extent permitted by applicable laws and regulations neither StoneX Financial Pte. Ltd. nor its associated companies will be responsible or liable for any loss or damage incurred arising out of, or in connection with, any use of the information contained in this report and all such liability is hereby expressly disclaimed. No representation or warranty is made, express or implied, that the content of this report is complete or accurate.
StoneX Financial Pte. Ltd. is not under any obligation to update this report.
Trading CFDs carries a high level of risk that may not be suitable for some investors. Consider your investment objectives, level of experience, financial resources, risk appetite and other relevant circumstances carefully. The possibility exists that you could lose some or all of your investments, including your initial deposits. If in doubt, please seek independent expert advice. Visit www.forex.com/en-sg/terms-and-policies for the complete Risk Disclosure Statement.