



Gold, EUR/USD hit 2026 lows as US yields erupt
US Treasury yields have staged one of their largest four-session increases in decades, hammering EUR/USD and gold. But while the euro's decline makes sense, gold's reaction has been extraordinary.
Share this:

- US Treasury yields surge in historic repricing
- Dollar's relationship with yields strengthens sharply
- EUR/USD tracks widening US–eurozone interest rate spreads
- Gold's shellacking far exceeds historical rate-shock norms
There's been a massive hawkish recalibration at the front end of the US interest rate curve this week, with a combination of persistently sticky consumer price inflation and hawkish commentary from Federal Reserve officials sending Treasury yields surging. With positioning potentially stretched following the substantial rally in bonds beforehand, the reversal has been extraordinary, producing one of the largest four-session increases in front-end yields seen in decades.
The move has propelled the US dollar to levels not seen since President Trump's Liberation Day tariff announcement in April last year, dragging both EUR/USD and gold to fresh 2026 lows in the process. But while the euro's decline has been broadly consistent with the repricing in relative interest rates, gold has been absolutely hammered, suffering one of its most severe sell-offs during a comparable Treasury market shock in modern history.
With New York Fed President John Williams set to speak shortly and US producer price inflation due on Friday, these loom as the two key known catalysts that could amplify or dampen the near-unprecedented move seen this week.
Treasury bloodbath ranks among the largest
With cash trading resuming on Thursday following the Veterans Day holiday, US Treasuries suffered yet another brutal sell-off, adding to what has already been a mammoth hawkish adjustment in interest rate expectations this week.
Source: LSEG
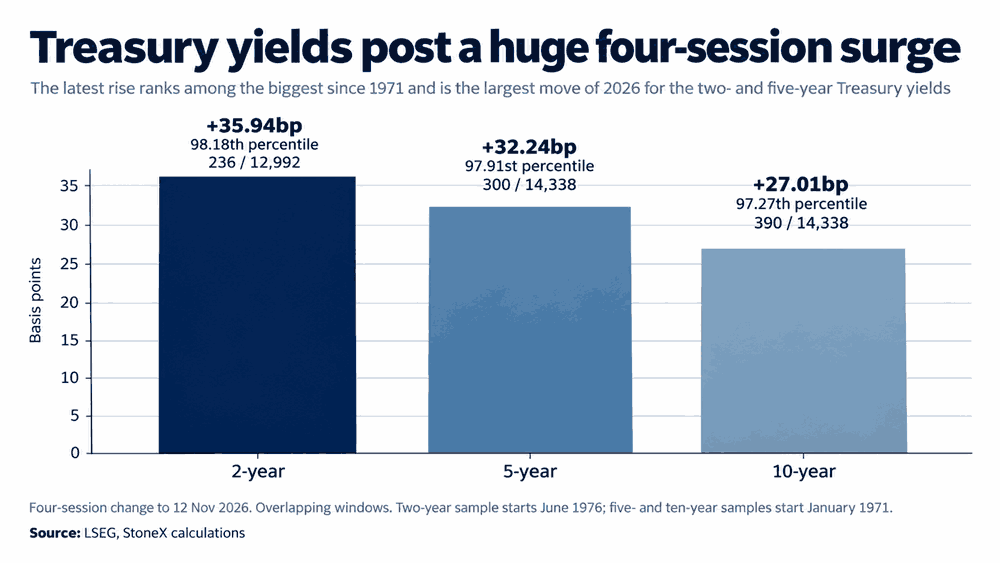
Over the four trading sessions to Thursday, two-year Treasury yields have now surged 35.94 basis points, with five-year yields up 32.24 basis points and ten-year yields climbing 27.01 basis points. For those who don't follow bonds closely, these moves are extraordinary, especially at the front end of the curve, where expectations for the Fed interest rate outlook are highly influential.
Looking at historical data, the increase in two-year yields ranks among the largest 1.8% of comparable four-session moves since 1976, with the five- and ten-year increases similarly rare in data stretching back to 1971. Zooming in on the period since 2000, when yields have generally been far lower than in preceding decades, the two-year move sits at the 99.7th percentile, a magnitude almost never seen over the past quarter-century.
US dollar takes its cues from Treasury yields
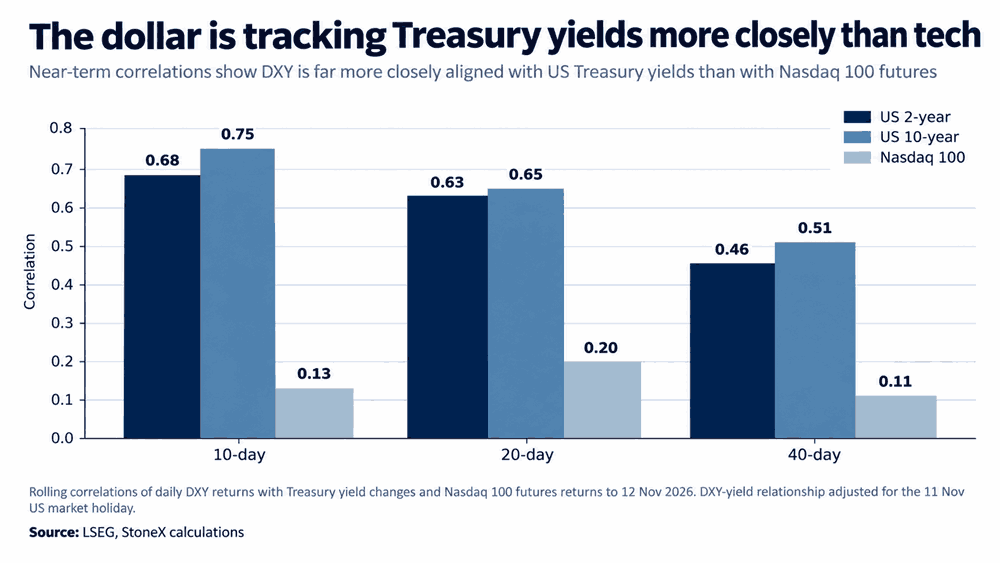
The hammering at the front end of the US Treasury curve has helped fuel an equally impressive rally in the US dollar, with the relationship between the two strengthening noticeably.
Source: LSEG
Over the past ten sessions, DXY's correlation with changes in two- and ten-year Treasury yields stands at +0.68 and +0.75, respectively, compared with just +0.13 against Nasdaq 100 futures. It suggests the curious relationship between the dollar and tech stocks, which pointed to markets using the latter as a proxy for the US nominal growth outlook, has lost much of its punch, with the increasingly hawkish Fed outlook now exerting greater influence.
Widening rate spreads hammer EUR/USD
The dramatic repricing at the front end of the US curve has also seen yield differentials move sharply against the euro, pushing EUR/USD to fresh 2026 lows. The six-month US–eurozone OIS spread, which tracks the difference in market expectations for average overnight interest rates over that period, has widened 14.23 basis points since last Friday, coinciding with a 0.80% decline in EUR/USD.
Based on the pair's sensitivity to changes in the spread over the preceding 20 sessions, the move is almost bang in line with the implied decline of 0.77%. In other words, the euro has fallen almost exactly as much as the shift in relative interest rates would suggest, reinforcing the importance of the Fed and ECB interest rate outlooks when assessing the pair's near-term directional risks.
EUR/USD breakdown puts 1.0900 in focus
Source: TradingView
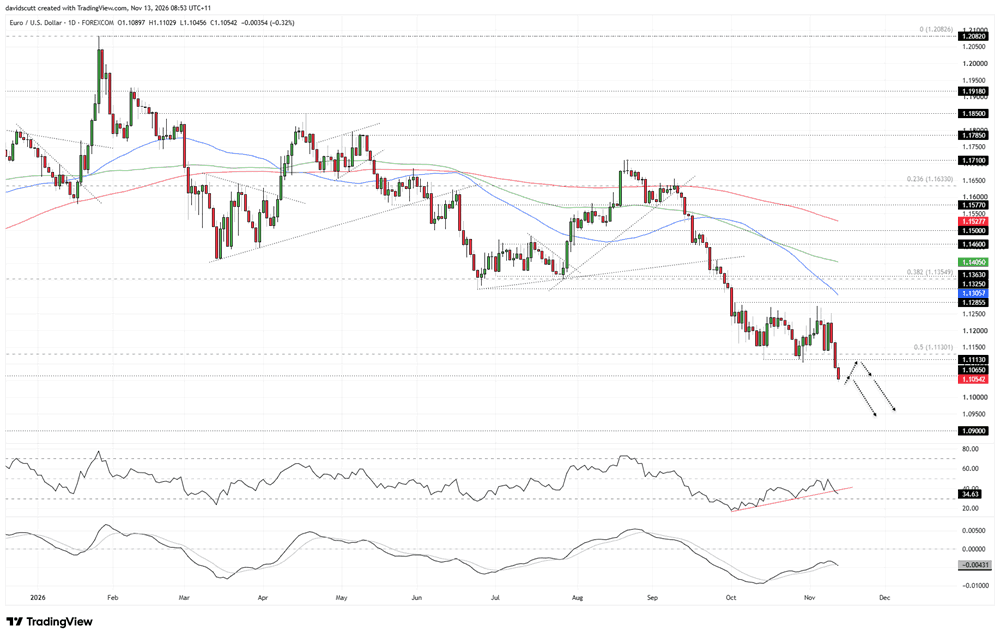
On the daily chart, the dramatic repricing in US interest rate expectations this week has seen EUR/USD once again fail to push meaningfully above resistance at 1.1250, triggering a sharp reversal that has taken out the 50% Fibonacci retracement of the January 2025 to January 2026 bull move, along with 1.1113, a swing low established on October 13 that subsequently acted as support in late October.
The price has since broken beneath 1.1065, a swing low established in May 2025, leaving both that level and 1.1113 as potential resistance overhead given their former roles as support. A push back towards either level that fails could present an opportunity to enter shorts in line with the prevailing trend, allowing for a tight stop to be placed above the respective level for protection.
Having broken beneath 1.1065, there's something of a vacuum in terms of known support levels, with little evident on the chart until 1.0900, suggesting the breakdown may have room to run.
Along with the pair trading beneath all its key medium- and long-term moving averages, all of which carry a negative slope, the bearish bias is backed up by the oscillators. RSI (14) has broken the uptrend in place since early October, setting a lower low and sitting just above oversold territory. MACD is confirming, having staged a bearish crossover while remaining in negative territory. With downside momentum rebuilding, the technical picture continues to favour short setups over longs.
Gold's shellacking stands out against history
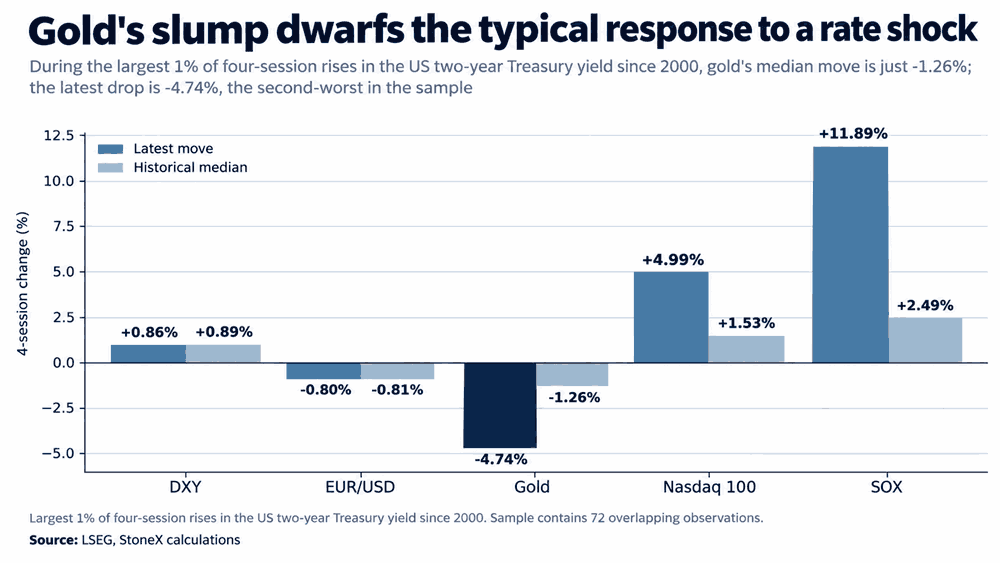
While the move in EUR/USD has been much as you'd expect given the shift in relative interest rate outlooks, the shellacking in gold has been one for the ages, with the decline far larger than typically seen during comparable hawkish yield shocks in the past.
Source: LSEG
Looking at the largest 1% of four-session increases in US two-year Treasury yields since 2000, gold has typically fallen around 1.26%, which makes sense given its inverse relationship with interest rates and the fact it offers no yield. But this week, it's plunged 4.74%, the second-largest decline among 72 overlapping observations over the same period, far larger than what you'd normally expect during a move of this magnitude.
Nor can the dollar's rally explain all the weakness. DXY has risen 0.85% over the same period, which, based on gold's sensitivity to dollar movements before the sell-off, as covered in separate analysis yesterday, would imply a decline of around 2%. Instead, gold has fallen more than twice as much, suggesting other influences may be compounding the selling pressure.
Gold's bearish trend remains intact
Source: TradingView
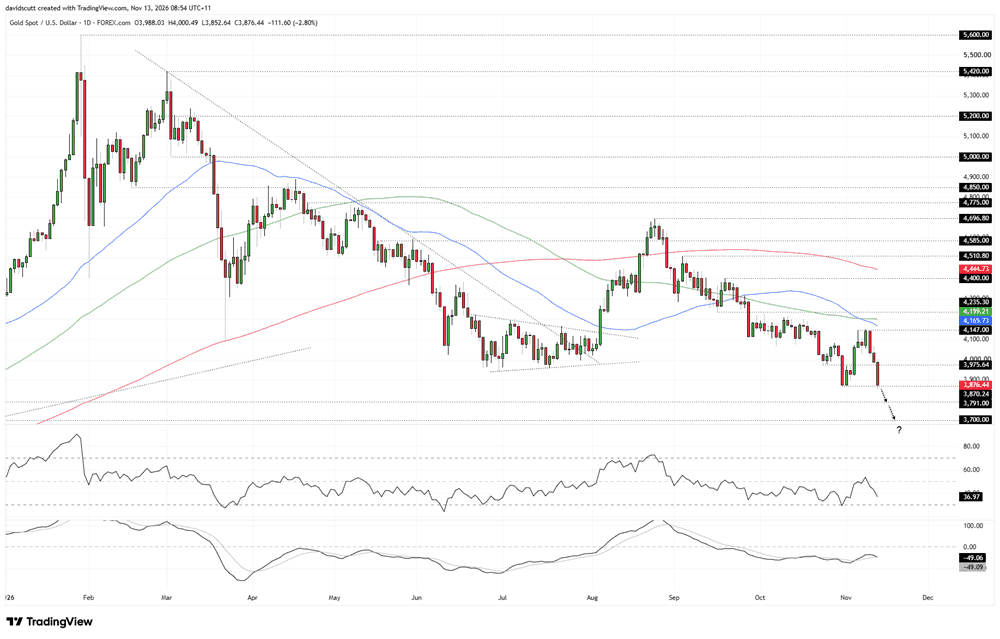
As flagged in Thursday's research piece, support at $3,975 eventually buckled heading into the European session, seeing gold trade down to and briefly beneath the previous 2026 low at $3,870.24. The price has since managed to reclaim that level, making it the immediate focal point underneath where it now trades, with $3,975 the level to watch overhead given its previous role as both support and resistance.
While gold has managed to reclaim $3,870.24, the prevailing bearish trend, with the price sitting beneath all its key medium- and long-term moving averages, all of which carry a negative slope, along with the signals from the momentum oscillators, suggests directional risks remain skewed to the downside, favouring short setups over longs.
If $3,870.24 breaks cleanly, levels to watch include $3,791 and $3,700. Neither is significant, having only acted as breakout zones during gold's rally in the second half of last year.
Alternatively, if gold continues to hold above $3,870.24, the option is to look for a counter-trend squeeze back towards $3,975 or even $4,147, where the price stalled on several occasions earlier this month. But for that trade to pay off, we'd likely need to see a decent unwind in the upward thrust in US Treasury yields and the dollar seen this week.
Williams, PPI pose the next major risks
As for what could spark such a move from a fundamental perspective, attention now shifts to New York Fed President John Williams, who is scheduled to speak shortly during a panel discussion, followed by the release of the US producer price inflation report for October later on Friday.
Williams has generally been towards the more dovish end of the Fed spectrum until recently, so any pushback against the aggressive tightening now priced into markets could help take some heat out of Treasury yields and the dollar. However, with Fed funds futures already pricing 29.1 basis points of tightening in December and a cumulative 47.1 basis points by January, it would likely take a shockingly weak PPI report to seriously challenge expectations for a December hike.
Conversely, should Williams join the hawkish chorus or PPI deliver another hot inflation print, it could stir the pot further, raising the risk of a 50 basis point hike in December, something markets currently assign a probability of around 16%.


Open an account in minutes
Experience award-winning platforms with fast and secure execution, and enjoy tight spreads from 0.5 pts on FX and 0.3 pts on indices.
Economic calendar
Web Trader platform
Our sophisticated web-based platform is packed with features.
Related articles
Bitcoin, Gold Outlook: Bullish Hold or Bearish Shift?
Bitcoin, Gold Outlook: The dollar’s surge to new 2026 highs and approach toward nine-month resistance are raising near-term reversal risks across precious metals and currency markets. This follows recent declines that pushed Bitcoin below $70,000 and gold below $3,870.

AUD/USD Outlook: Historic yield squeeze leaves Aussie bears in control
Australian bond yields have fallen below their US equivalents as the Fed's hawkish repricing gathers momentum. With the Aussie weakening broadly, technical signals suggest sellers remain in control.


Gold, EUR/USD hit 2026 lows as US yields erupt
US Treasury yields have staged one of their largest four-session increases in decades, hammering EUR/USD and gold. But while the euro's decline makes sense, gold's reaction has been extraordinary.
This report is intended for general circulation only. It should not be construed as a recommendation, or an offer (or solicitation of an offer) to buy or sell any financial products. The information provided does not take into account your specific investment objectives, financial situation or particular needs. Before you act on any recommendation that may be contained in this report, independent advice ought to be sought from a financial adviser regarding the suitability of the investment product, taking into account your specific investment objectives, financial situation or particular needs.
StoneX Financial Pte. Ltd., may distribute reports produced by its respective foreign entities or affiliates within the StoneX group of companies or third parties pursuant to an arrangement under Regulation 32C of the Financial Advisers Regulations. Where the report is distributed to a person in Singapore who is not an accredited investor, expert investor or an institutional investor (as defined in the Securities Futures Act), StoneX Financial Pte. Ltd. accepts legal responsibility to such persons for the contents of the report only to the extent required by law. Singapore recipients should contact StoneX Financial Pte. Ltd. at 6826 9988 for matters arising from, or in connection with the report.
In the case of all other recipients of this report, to the extent permitted by applicable laws and regulations neither StoneX Financial Pte. Ltd. nor its associated companies will be responsible or liable for any loss or damage incurred arising out of, or in connection with, any use of the information contained in this report and all such liability is hereby expressly disclaimed. No representation or warranty is made, express or implied, that the content of this report is complete or accurate.
StoneX Financial Pte. Ltd. is not under any obligation to update this report.
Trading CFDs carries a high level of risk that may not be suitable for some investors. Consider your investment objectives, level of experience, financial resources, risk appetite and other relevant circumstances carefully. The possibility exists that you could lose some or all of your investments, including your initial deposits. If in doubt, please seek independent expert advice. Visit www.forex.com/en-sg/terms-and-policies for the complete Risk Disclosure Statement.