



Gold forecast: Precious metals achieve first record highs of 2026
Gold and silver have wasted little time in making their first record highs of 2026. The yellow metal topped $4600 for the first time ever while the grey metal neared the $85.00 level. The obvious question now is whether this year turns into a repeat of last year, with a series of fresh highs, or whether this move proves to be more short-lived.
Share this:

Gold and silver have wasted little time in making their first record highs of 2026. The yellow metal topped $4600 for the first time ever while the grey metal neared the $85.00 level. The obvious question now is whether this year turns into a repeat of last year, with a series of fresh highs, or whether this move proves to be more short-lived. For the moment, though, the path of least resistance remains firmly to the upside for both gold and silver. As long as price action continues to respect the sequence of higher highs and higher lows, there is little merit in trying to pick a top. That said, our 2026 gold forecast is not super bullish, but that shouldn’t be mistaken for shorting it. For indeed, fading moves in a strong uptrend is rarely a profitable exercise.
Gold glitters as Fed independence called into question
The main catalyst behind today’s move has been a surprise announcement that federal prosecutors have opened a criminal investigation into Federal Reserve Chair Jerome Powell. That development immediately raised concerns around the Fed’s independence, prompting investors to sell US assets broadly and rotate into traditional safe havens. Gold and silver both surged to record levels as markets digested the implications.
According to Powell, the investigation stems from the Fed’s reluctance to align interest-rate policy with White House preferences. Gold briefly pushed above $4,600 before easing back slightly. The latest gains in precious metals, alongside a sharp drop in the dollar, come just days after a mixed US jobs report on Friday that had initially helped the greenback extend its advance.
If fears around Fed independence fade quickly, gold could see some near-term pressure as the dollar regains its footing. My base case, however, is that Powell serves out the remainder of his term and that monetary policy continues to be guided by incoming economic data rather than political influence. If that proves correct, attention should shift back to the macro picture fairly swiftly, with CPI and retail sales firmly in focus this week.
Gold forecast: Dollar in focus ahead of CPI release
Following Friday’s mixed-to-soft US labour market data, tomorrow’s inflation report is expected to show headline CPI unchanged at 2.7% year-on-year, while both headline and core measures are forecast to rise by 0.3% on the month. A core reading even marginally above consensus could be enough to reignite a dollar rally.
At the same time, markets are also watching for a potentially unfavourable Supreme Court ruling on Trump’s tariffs, which could emerge at some point this week and may lend further support to the dollar. For now, though, those factors feel secondary. Investors are likely to demand greater clarity on the Fed situation before rebuilding meaningful dollar long positions. A much weaker inflation print combined with lingering doubts over Fed independence could instead trigger a deeper and more disorderly USD sell-off.
Geopolitical risks continue to underpin gold prices
Beyond monetary and political concerns, gold remains well supported by ongoing geopolitical risks. While tensions had eased somewhat in recent weeks, the latest flare-up involving Iran has reintroduced a fresh layer of uncertainty. The key risk is the prospect of renewed US involvement in the region.
Elsewhere, developments in Venezuela and renewed focus on Greenland serve as timely reminders that geopolitical shocks can re-emerge quickly and with little warning. Against that backdrop, safe-haven demand is likely to remain intact until tensions in Iran cool and greater clarity emerges around these broader geopolitical flashpoints, keeping the near-term gold forecast positive.
Gold technical analysis and key levels to watch
From a technical standpoint, gold’s trend remains firmly constructive. The market continues to print a clean sequence of higher highs and higher lows, making aggressive bearish calls difficult to justify. As long as that structure remains intact, selling gold with conviction makes little sense for trend followers, even if mean-reversion traders may argue otherwise. For most participants, a clear and decisive bearish signal is needed before short positions become attractive. While momentum indicators suggest the market is overbought, that alone is not a sufficient reason to sell.
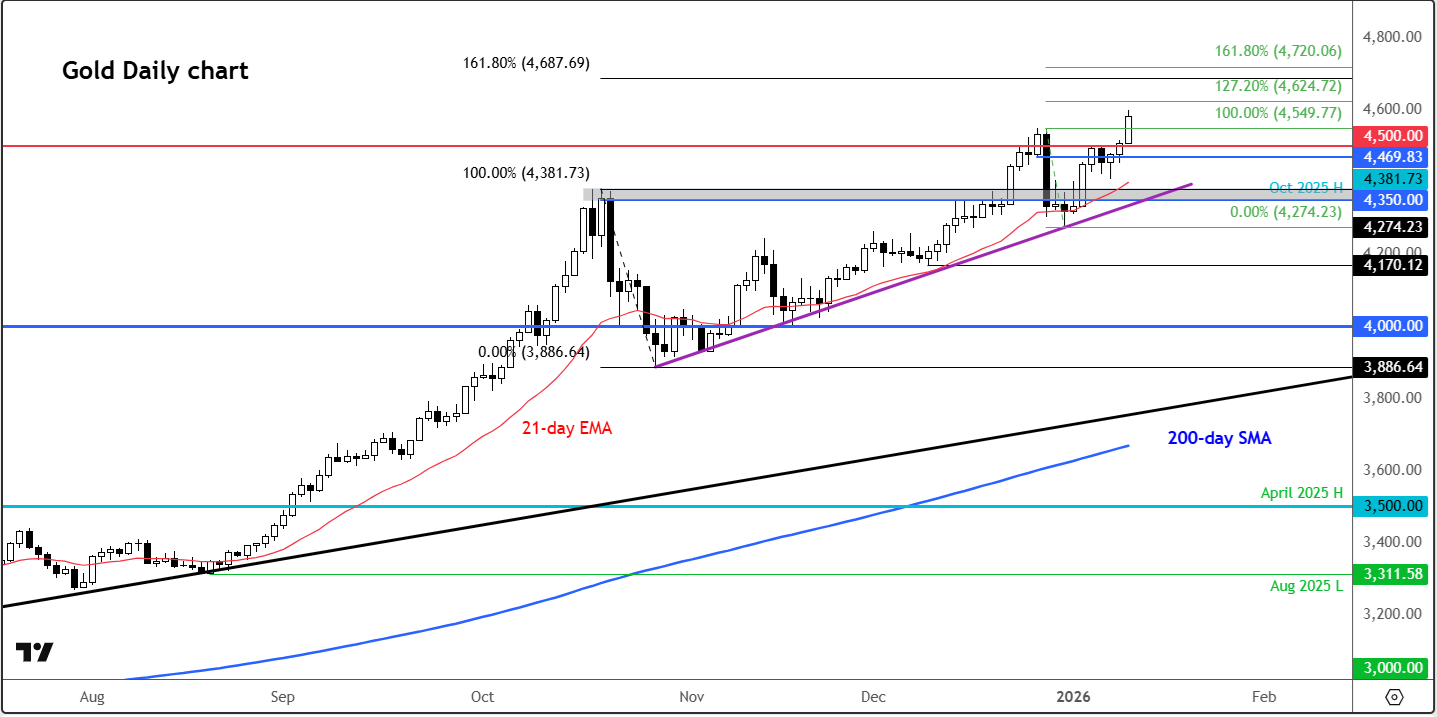
On the downside, the first area of support on spot gold prices lies between $4,500 and $4,550. This zone marks the former record high from December and carries clear psychological significance. Below there, the previous October high sits around $4,380, followed by rising trendline support near $4,350. The $4,350–$4,380 region, highlighted in grey on my chart, previously acted as stubborn resistance before gold finally broke higher in December. Although prices briefly dipped below this area, they quickly reclaimed it at the start of the year before pushing on to fresh record highs. For me, this zone represents the line in the sand. A clean move back below it would shift the balance of risks on the gold forecast and open the door to a deeper corrective phase.
On the topside, there are no obvious resistance levels visible on the chart, which naturally brings the next round-number targets at $4,600 and $4,700 into view. It is also worth keeping an eye on the Fibonacci extension levels at $4,625, $4,687 and $4,720, as these areas may attract profit-taking from Fibonacci-focused traders.

-- Written by Fawad Razaqzada, Market Analyst
Follow Fawad on Twitter @Trader_F_R
Related tags:
Latest market news




Open an account in minutes
Experience award-winning platforms with fast and secure execution, and enjoy tight spreads from 0.5 pts on FX and 0.3 pts on indices.
Economic calendar
Web Trader platform
Our sophisticated web-based platform is packed with features.
Related articles
ASX 200 Futures Hold Relatively Firm as Nikkei Plunges After Wall Street Rout
Wall Street's AI-led rout sends Nikkei futures plunging 9%, while ASX 200 futures hold relatively firm despite surging volatility and broader risk aversion.
Canadian Dollar Short-term Outlook: USD/CAD Plunge Stalls at Pivotal Support—Range Break in Focus 11 5 2026
Friday’s U.S. and Canadian employment reports could trigger a decisive USD/CAD move as bulls and bears battle for control at critical support.


US Dollar Technical Outlook: DXY Bulls Fight to Hold Critical Support Ahead of NFP 11 5 2026
DXY bulls are attempting to defend a pivotal technical threshold, with the next reaction likely to determine whether the broader recovery survives.
This report is intended for general circulation only. It should not be construed as a recommendation, or an offer (or solicitation of an offer) to buy or sell any financial products. The information provided does not take into account your specific investment objectives, financial situation or particular needs. Before you act on any recommendation that may be contained in this report, independent advice ought to be sought from a financial adviser regarding the suitability of the investment product, taking into account your specific investment objectives, financial situation or particular needs.
StoneX Financial Pte. Ltd., may distribute reports produced by its respective foreign entities or affiliates within the StoneX group of companies or third parties pursuant to an arrangement under Regulation 32C of the Financial Advisers Regulations. Where the report is distributed to a person in Singapore who is not an accredited investor, expert investor or an institutional investor (as defined in the Securities Futures Act), StoneX Financial Pte. Ltd. accepts legal responsibility to such persons for the contents of the report only to the extent required by law. Singapore recipients should contact StoneX Financial Pte. Ltd. at 6826 9988 for matters arising from, or in connection with the report.
In the case of all other recipients of this report, to the extent permitted by applicable laws and regulations neither StoneX Financial Pte. Ltd. nor its associated companies will be responsible or liable for any loss or damage incurred arising out of, or in connection with, any use of the information contained in this report and all such liability is hereby expressly disclaimed. No representation or warranty is made, express or implied, that the content of this report is complete or accurate.
StoneX Financial Pte. Ltd. is not under any obligation to update this report.
Trading CFDs carries a high level of risk that may not be suitable for some investors. Consider your investment objectives, level of experience, financial resources, risk appetite and other relevant circumstances carefully. The possibility exists that you could lose some or all of your investments, including your initial deposits. If in doubt, please seek independent expert advice. Visit www.forex.com/en-sg/terms-and-policies for the complete Risk Disclosure Statement.