



Gold Goes Deep Oversold as XAU/USD Continues Post-Fed Snapback
Spot Gold (XAU/USD) has seen RSI drive below 20 on the daily chart, which has only happened three other times in the past 20 years.
Share this:

Gold, XAU/USD Talking Points:
- Gold prices are working on another bearish daily bar, which would be the ninth consecutive bearish daily candle if today finishes in the red.
- Spot gold has come off so quickly after the FOMC rate decision that RSI on the daily chart closed below the 20 level yesterday, and that would the first such instance in more than six years. And this has only happened three other times over the past 20 years, with all taking place since the 2013 open.
- I’ll be discussing these themes in-depth in the weekly webinar on Tuesday at 1PM ET. It’s free for all to register: Click here to register.
Gold prices have continued to fall with aggression, with a total move of -6.9% from the Fed Day high down to this morning’s low. Perhaps more disconcerting for gold bulls is that the factor that seemed to push the theme, jumping Treasury yields, have relaxed over the past two days but the sell-off in gold has held for a ninth consecutive day, as of this writing.
If this all seems like it’s happened quickly, well, it has. Even as we were going into the FOMC rate decision there was bullish scope for gold, as even a strong USD was unable to derail gold’s support hold at higher lows. But something shifted at that rate decision and that remains in-play today. The obvious takeaway from September FOMC was rising yields on the back of two fewer cuts expected for next year. This has led to collateral damage in a number of markets, gold included.
To illustrate the haste with which this theme has priced in, Relative Strength readings in gold are at an extreme level, with yesterday’s daily close showing RSI below the 20 level. That’s rare, and the last time we had a similar instance was December of 2016 when gold was trading below the $1,200/oz level.
Spot Gold (XAU/USD) Daily Chart with RSI Going Back to 2013
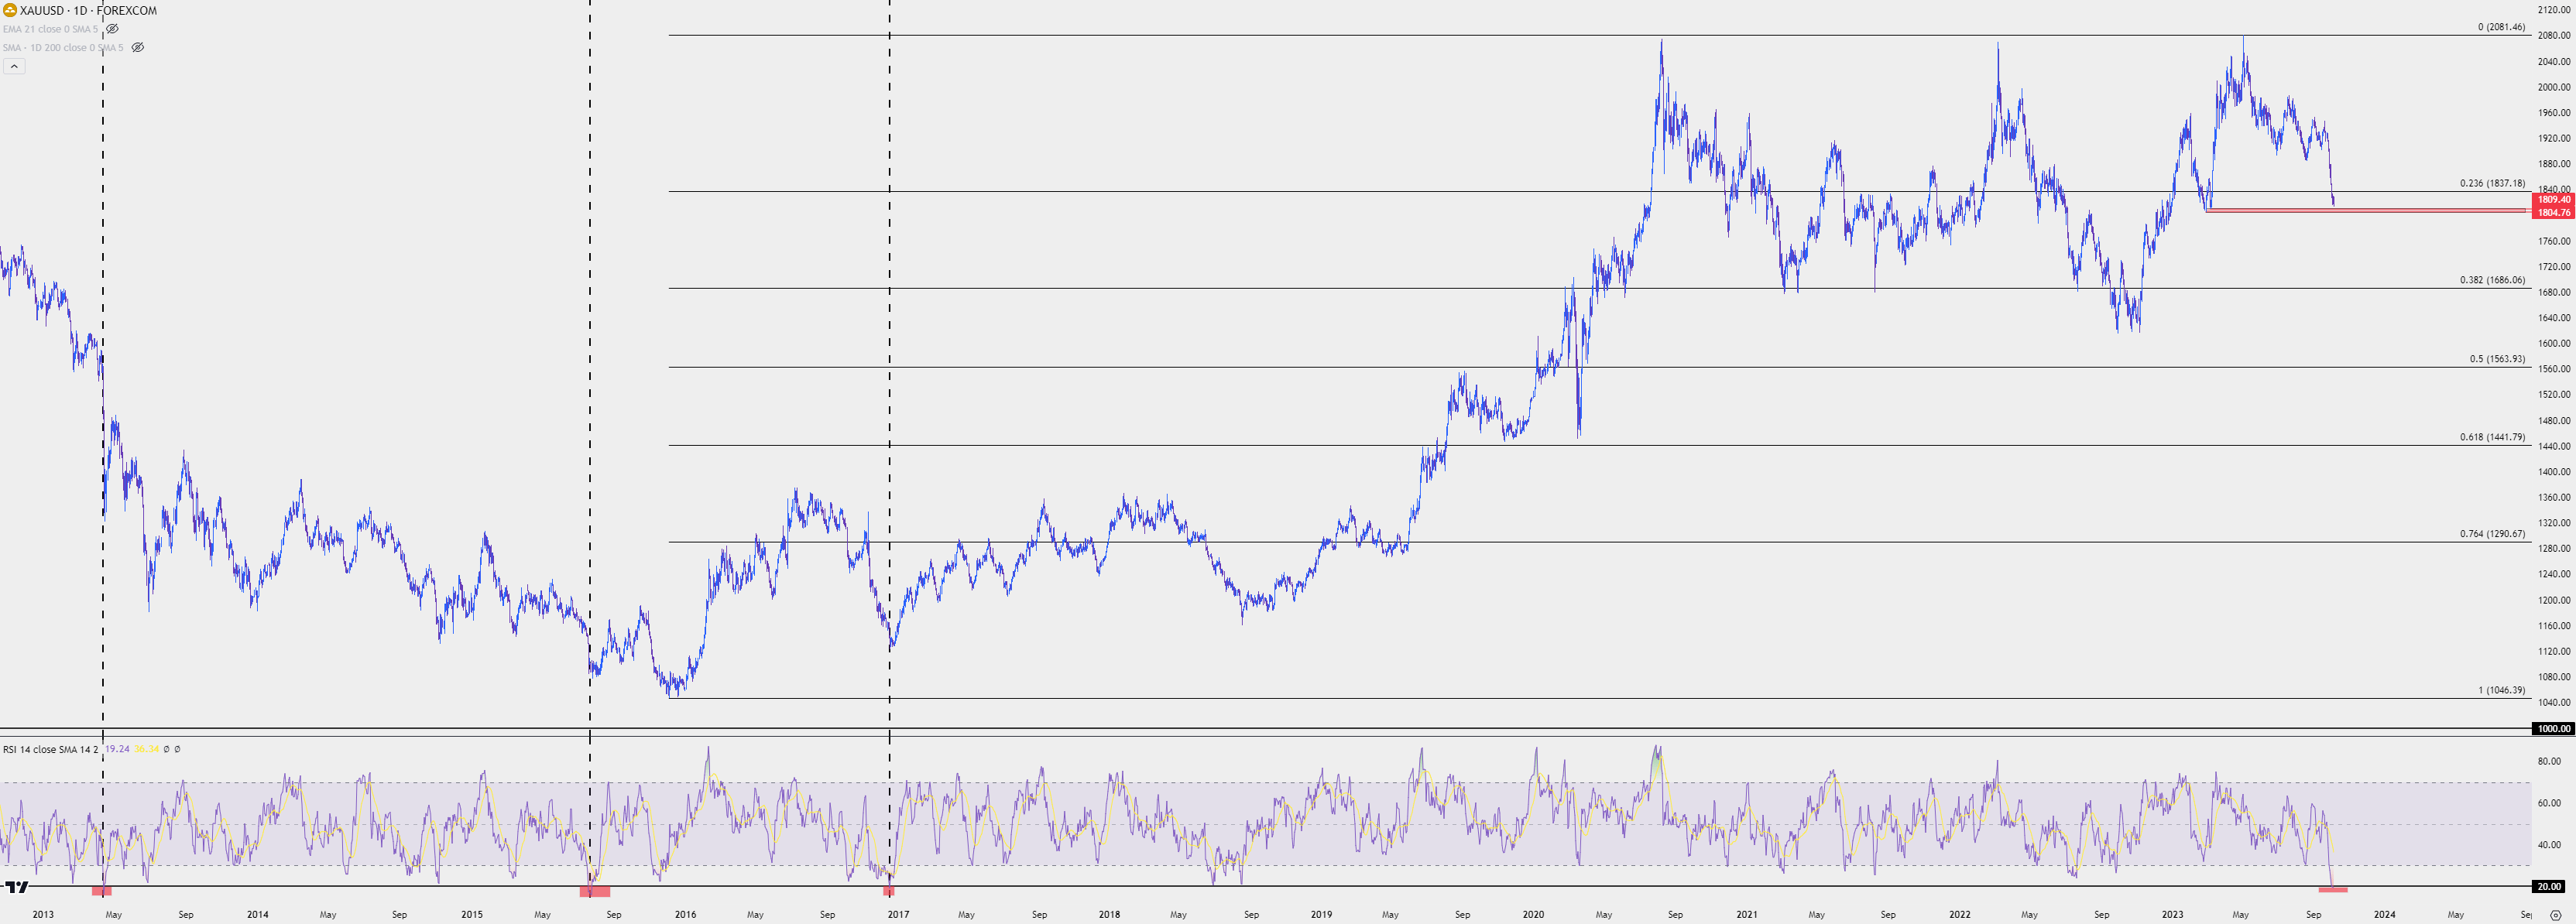 Chart prepared by James Stanley, Gold on Tradingview
What Does 2013, 2015 or 2016 have to do with today?
Three instances do not allow for a valid sample pool. The reason that this can matter is what it says about the context of the market at the time, where deep oversold scenarios can be challenging to draw new sellers into the trend. And this matters from a sentiment perspective, because if a market is heavily short, as highlighted by an aggressive bearish run, then logically there’s a lot of open short positions that will need to cover at some point if they want to close the position. That can lead to demand, and if that demand to close the position is greater than the supply being offered by fresh sellers, well, we can see the market move higher.
Whether or not that turns into a full-fledged bullish reversal will likely be governed by buyer/seller activity. If sellers remain aggressive, then lower-high resistance can draw fresh shorts back into the market, and if enough sellers come into the matter to dominate demand, well then prices can continue the prior bearish trend, and this is what helps to develop lower-lows and lower-highs.
We’re not quite there yet on gold as prices are still holding near lows but given how quickly the move came off combined with proximity to support, the question must be asked as to whether gold is in a position to plot for pullbacks. And, if so, the big question is where sellers might re-enter the matter.
From the daily chart we can see a key zone of support coming nearer, and this plots from a collection of support points that were in-play in March. This runs from around 1804 up to 1809 and it hasn’t traded yet, as prices have stalled before testing this very obvious support zone at six-month lows.
This highlights a couple of different possible scenarios: Perhaps bears are getting less aggressive as the though of a possible bounce from support comes into the picture. This could also keep the door open for a capitulation type of move tomorrow as the Non-farm Payrolls report is on the calendar for tomorrow, which is a scenario that could happen if bears try to breach the support zone but are quickly met with buying pressure. There’s another support level below that batch of prior swing lows and that’s the 61.8% Fibonacci retracement of the recent bullish move.
Gold (XAU/USD) Daily Price Chart
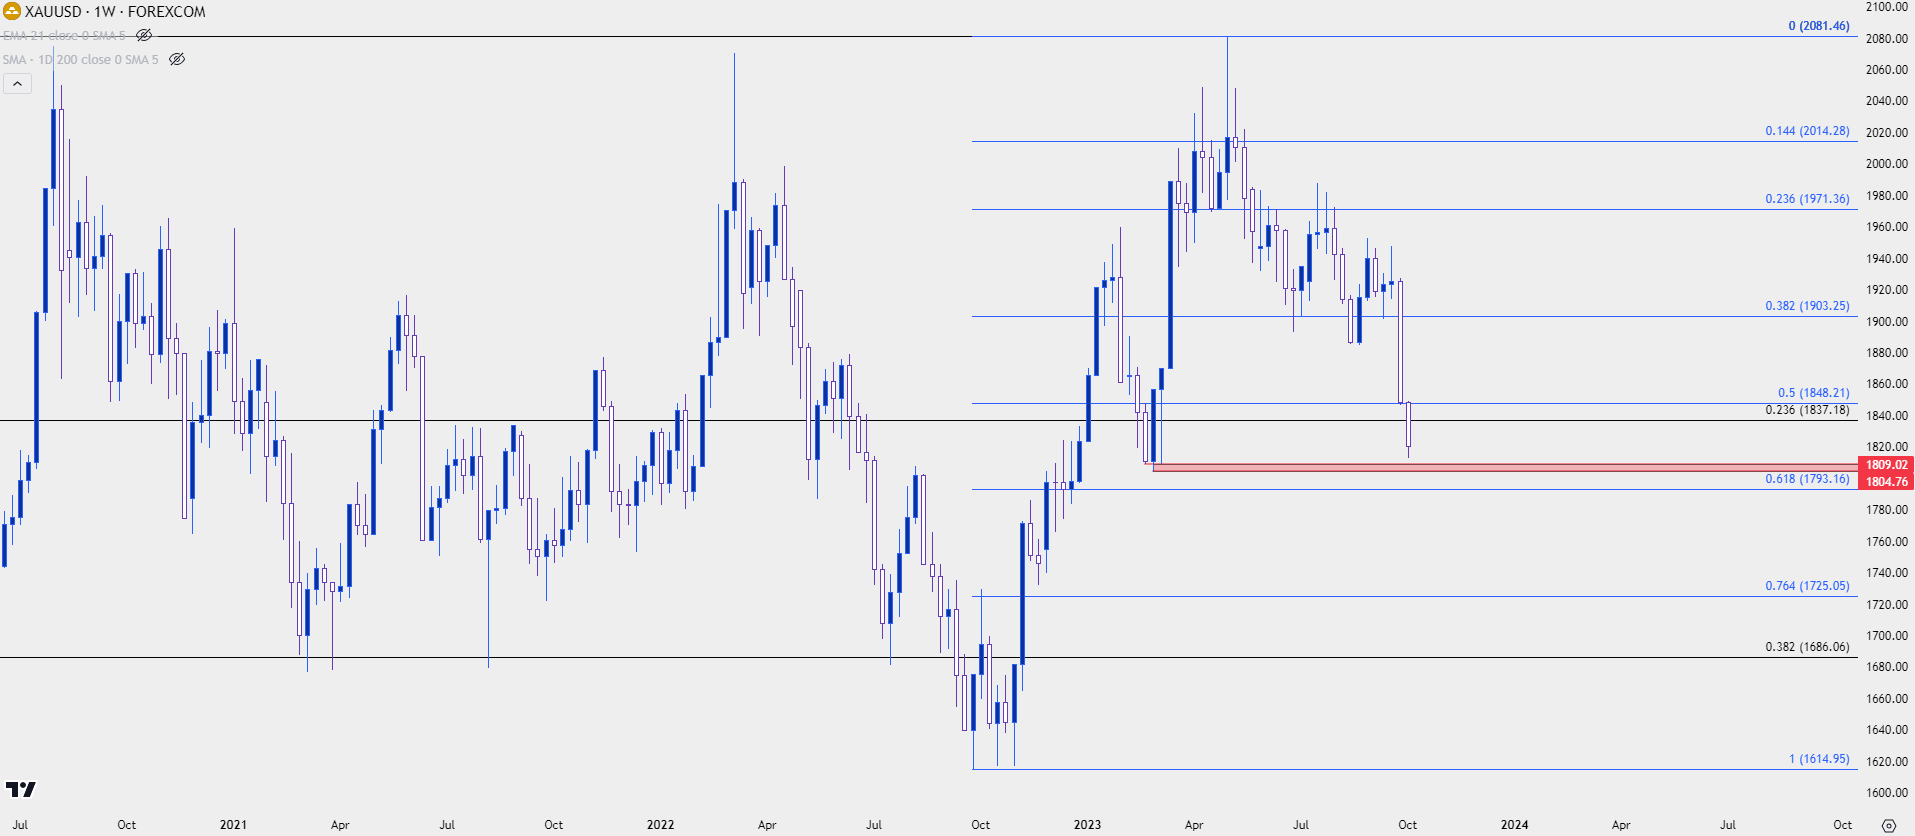
Chart prepared by James Stanley, Gold on Tradingview
Gold (XAU/USD) Shorter-Term
From the four-hour chart below, we can see that bearish trend starting to show some elements of stall over the past couple days. Bulls haven’t taken over, as can be evidenced by continued lower highs. But the pace of lower lows hasn’t quite kept up, allowing for the build of a falling wedge formation building just above that support zone taken from the March lows.
The shorter-term chart also highlights a couple areas of possible lower-high resistance, with both 1837 and 1848 carrying some potential. It’s the 1880-1885 zone that looms large as this was a swing-low in August that because a spot of resistance during the post-Fed sell-off.
Gold (XAU/USD) Four-Hour Price Chart
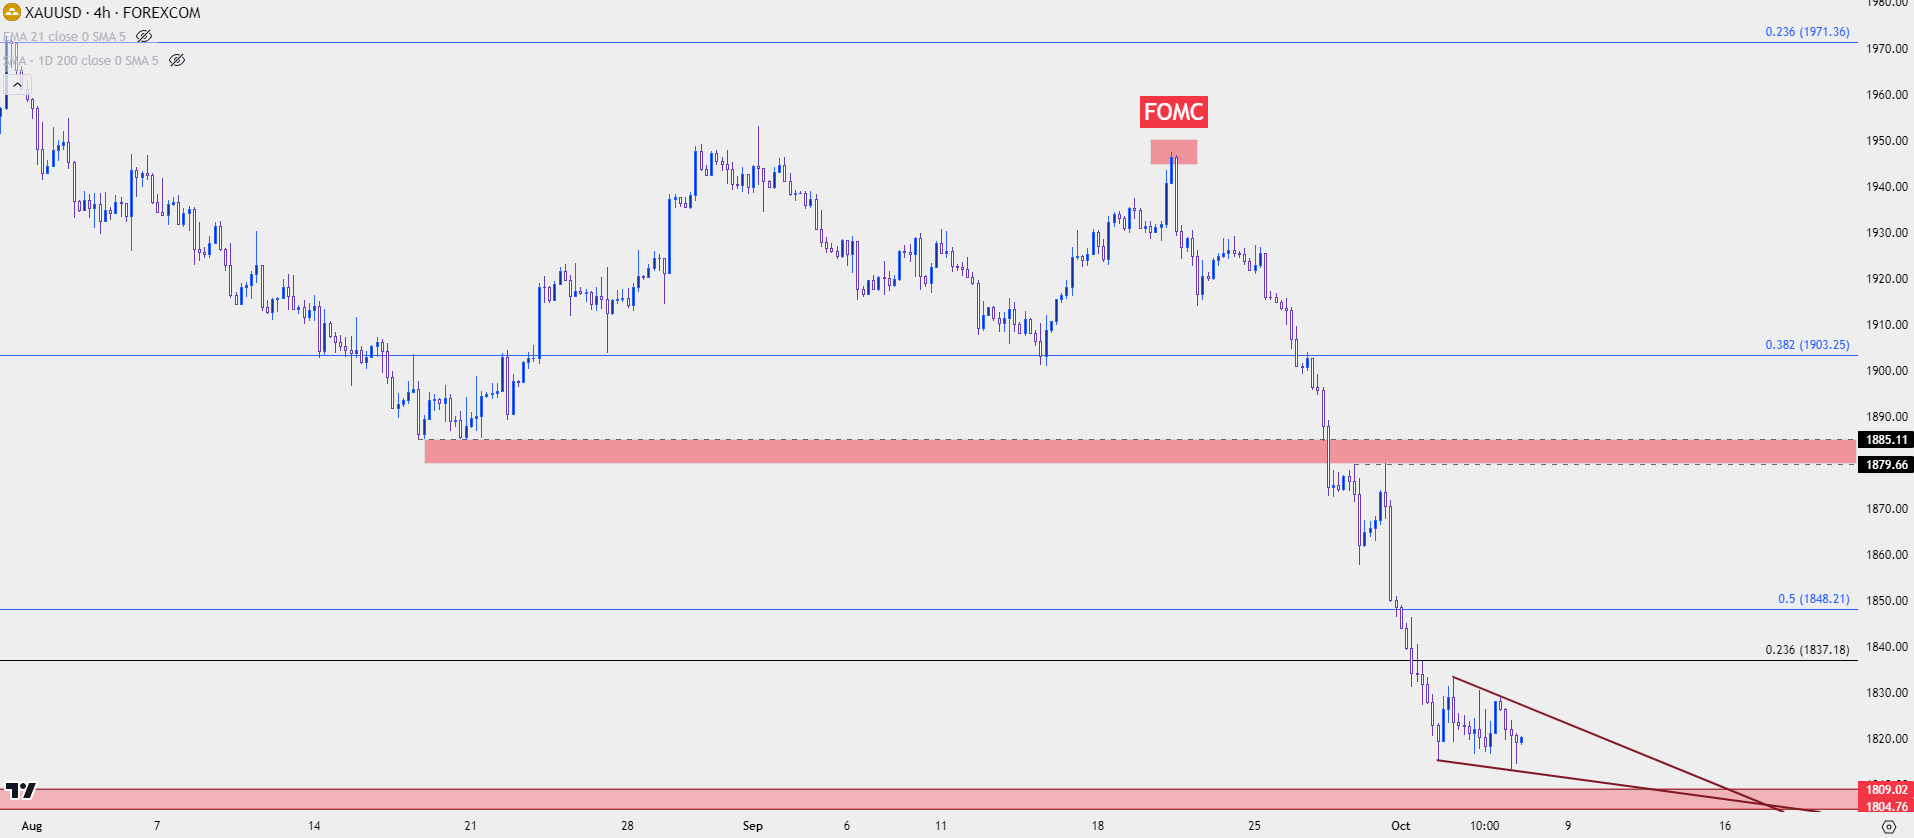 Chart prepared by James Stanley, Gold on Tradingview
--- written by James Stanley, Senior Strategist
Related tags:
Latest market news




Open an account in minutes
Experience award-winning platforms with fast and secure execution, and enjoy tight spreads from 0.5 pts on FX and 0.3 pts on indices.
Economic calendar
Web Trader platform
Our sophisticated web-based platform is packed with features.
Related articles
US Dollar Price Action Setups: EUR/USD, USD/JPY, GBP/USD, USD/CAD
The US Dollar remained strong last week even as EUR/USD started to show a series of higher-lows. USD/JPY continues to be bought on dips as the fundamental deviation between the two economies remains front-and-center.
Australian Dollar Short-term Outlook: AUD/USD Rebound Challenges September Downtrend 10 9 2026
Aussie is pressing a key trend barrier after rebounding from support, with next week’s CPI report poised to test the recovery.


DAX, Gold and Bitcoin forecast: Dollar falls, yields retreat as risk appetite returns
Markets went from risk off to risk on yesterday afternoon and we have since kicked on with some follow-up buying of stocks, gold and silver, while the dollar has also shown signs of weakness. Risk appetite turned positive after bond yields and oil prices both retreated yesterday.

This report is intended for general circulation only. It should not be construed as a recommendation, or an offer (or solicitation of an offer) to buy or sell any financial products. The information provided does not take into account your specific investment objectives, financial situation or particular needs. Before you act on any recommendation that may be contained in this report, independent advice ought to be sought from a financial adviser regarding the suitability of the investment product, taking into account your specific investment objectives, financial situation or particular needs.
StoneX Financial Pte. Ltd., may distribute reports produced by its respective foreign entities or affiliates within the StoneX group of companies or third parties pursuant to an arrangement under Regulation 32C of the Financial Advisers Regulations. Where the report is distributed to a person in Singapore who is not an accredited investor, expert investor or an institutional investor (as defined in the Securities Futures Act), StoneX Financial Pte. Ltd. accepts legal responsibility to such persons for the contents of the report only to the extent required by law. Singapore recipients should contact StoneX Financial Pte. Ltd. at 6826 9988 for matters arising from, or in connection with the report.
In the case of all other recipients of this report, to the extent permitted by applicable laws and regulations neither StoneX Financial Pte. Ltd. nor its associated companies will be responsible or liable for any loss or damage incurred arising out of, or in connection with, any use of the information contained in this report and all such liability is hereby expressly disclaimed. No representation or warranty is made, express or implied, that the content of this report is complete or accurate.
StoneX Financial Pte. Ltd. is not under any obligation to update this report.
Trading CFDs carries a high level of risk that may not be suitable for some investors. Consider your investment objectives, level of experience, financial resources, risk appetite and other relevant circumstances carefully. The possibility exists that you could lose some or all of your investments, including your initial deposits. If in doubt, please seek independent expert advice. Visit www.forex.com/en-sg/terms-and-policies for the complete Risk Disclosure Statement.