



Gold Goes for $5k – Is there Any End in Sight to the XAU/USD Rally?
Spot gold came within $2 of the $5k level last week but perhaps more important is how buyers responded to the pullback on Tuesday and Wednesday, showing strong appetite on pullback scenarios.
Share this:

It might be hard to remember but there was once upon a time that gold was called a ‘pet rock.’ And even in a more modern era, there was a three-and-a-half year period where gold just could not get above the $2k level, despite the fundamental backdrop being seemingly perfect for rallies in the metal. But since finally finding support at that price back in early-2024 trade gold has continued in a historic run that’s now seen a whopping 150% added on to its price in a little under two years. At this point there’s little question as to whether the metal is viable investment medium and perhaps the biggest challenge for investors is gold’s own success as the move has been virtually parabolic of late.

To drive back to the big picture the largest driver for gold appears to be government spending. The balanced budgets and (relative) fiscal austerity of the late 1990’s has led into aggressive spending and rising debt loads that have only seemed to grow more and more. The Iraq war led to budgetary expansion, which helped to prod gold up to and past the $500/oz level. The Financial Collapse certainly played a role, as gold first tested the $1k/oz level in March of 2008, although it took a year and a half before it could finally leave that price behind. And then the response to the financial collapse drove an aggressive move that, eventually, saw gold stall just $80 below the $2k figure in 2011.
Gold Weekly Chart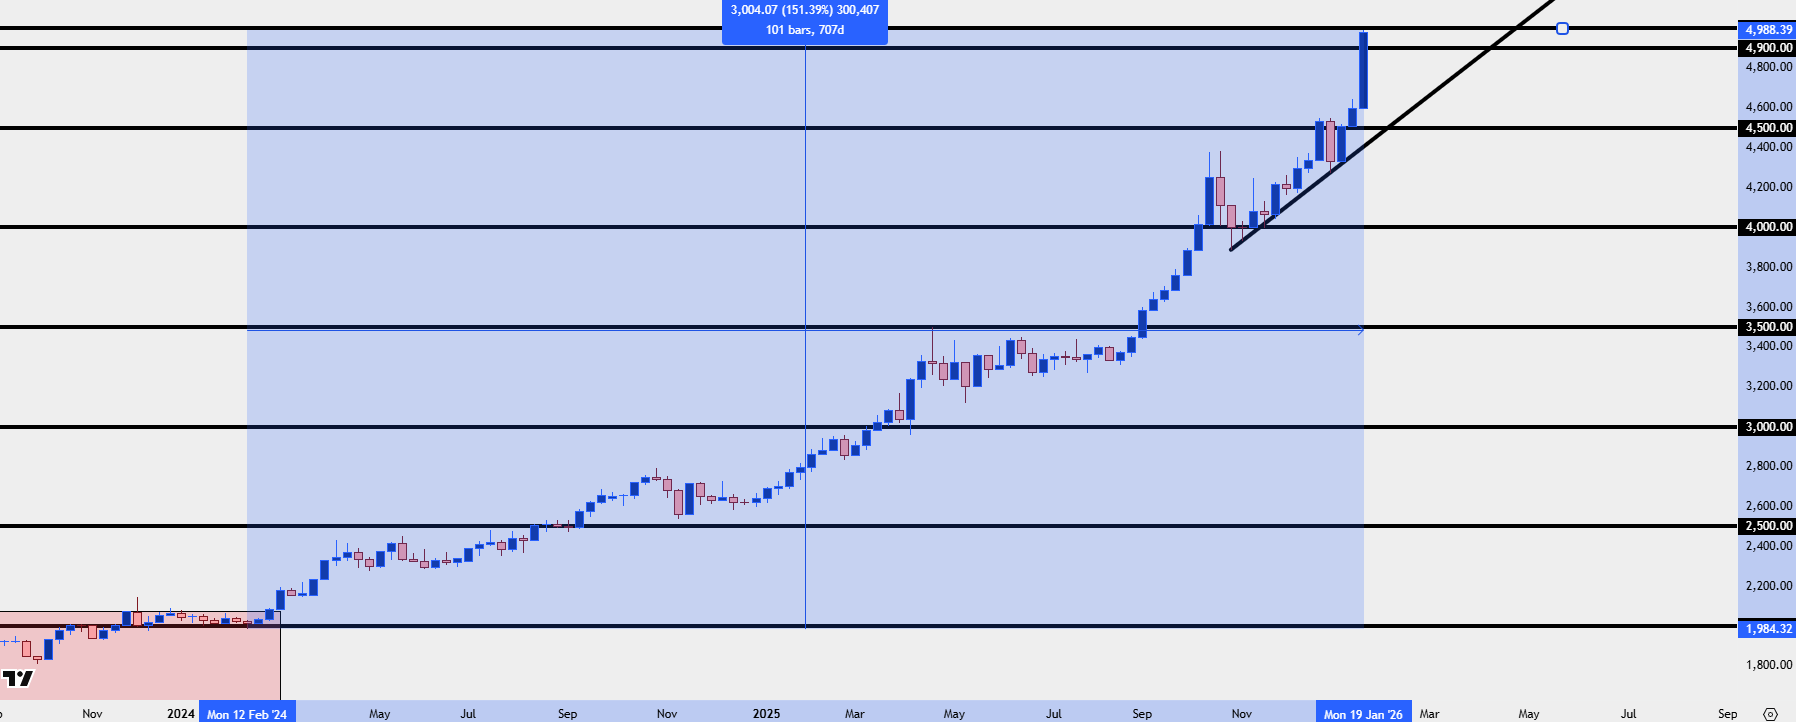
Chart prepared by James Stanley; data derived from Tradingview
There’s a good news/bad news thing with trends like we have in gold. While the directional move has remained clear, the excitement has built so much that exacting entry can be a challenge as there’s been only limited pullbacks.
And, interestingly, it seems as though much of the crowd is the least interested when one of those pullbacks is actually happening. This explains the bull pennant consolidation formations that built at the end of 2024 or for the four-month period in 2025, leading into the Jackson Hole Economic Symposium. And as Jerome Powell opened to the possibility of cutting rates gold prices flew higher and there’s only been brief pauses ever since.
On a shorter-term basis, there has been bullish structure building. Just a couple of weeks ago, gold formed a falling wedge which is a bullish reversal formation. At the time, price was holding support around prior resistance of $4402 and that led to another strong rally. Then last week, we had a pullback as well and this time, gold formed an ascending triangle formation, which is a bullish breakout formation and that cleared on Thursday morning.
Gold Four-Hour Chart: The Falling Wedge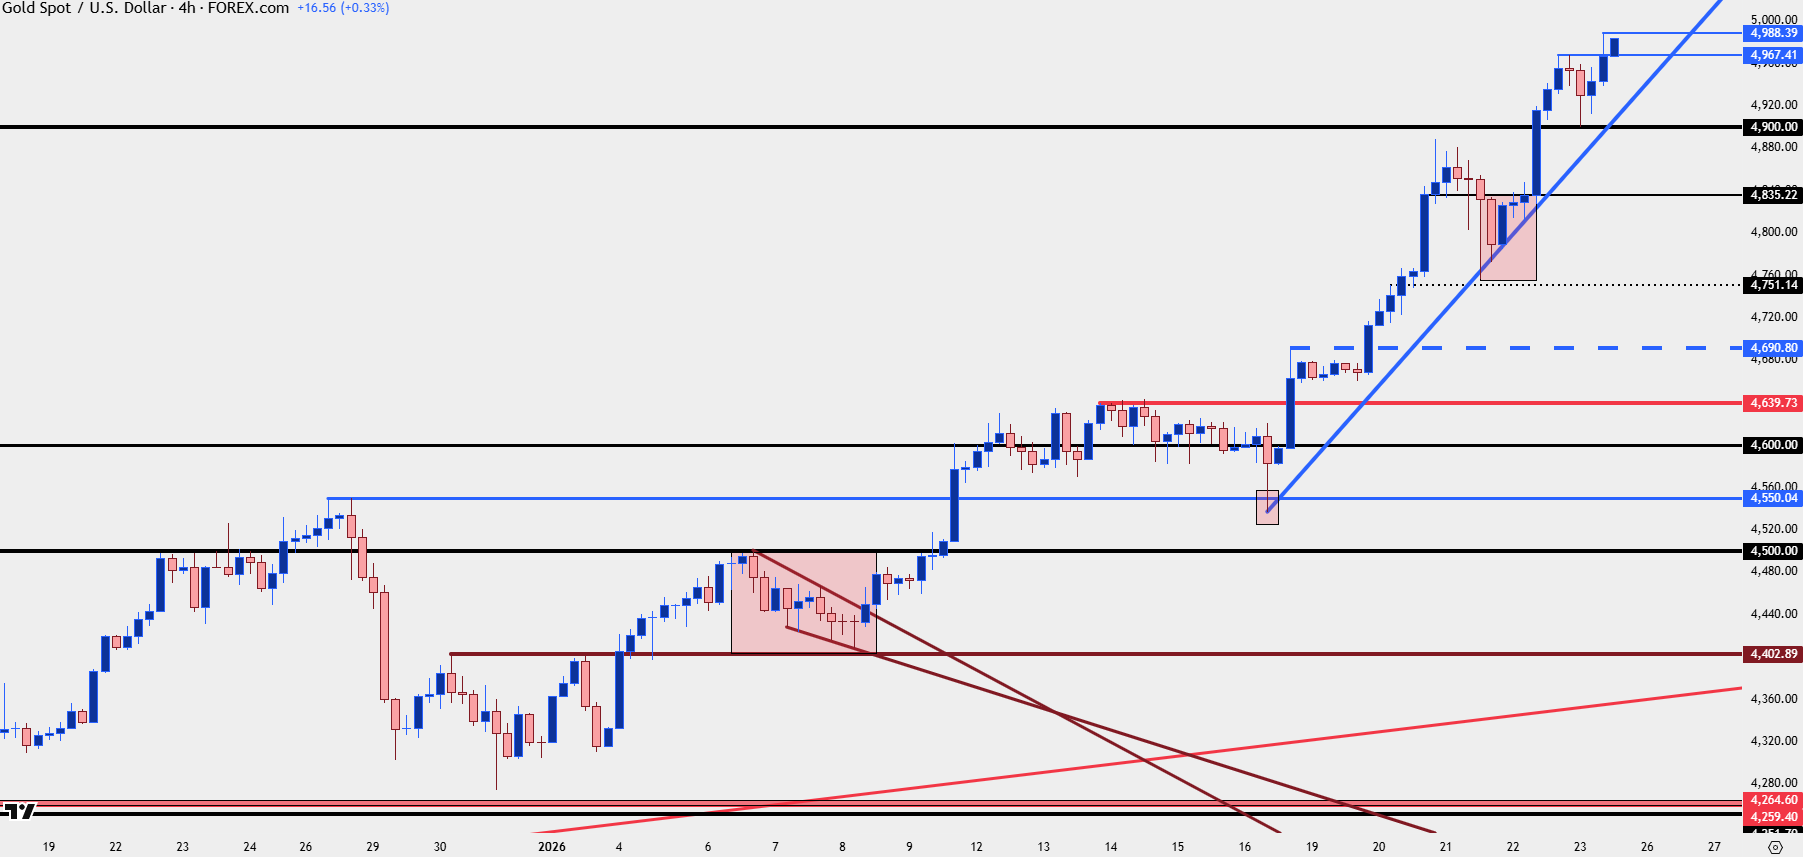
Chart prepared by James Stanley; data derived from Tradingview
So, to say that there hasn’t been open windows to establish bullish exposure without having to chase wildly wouldn’t quite be accurate. It’s just that patience isn’t a common thread in markets and when price has pulled back, that’s when the crowd is seemingly least interested in continuation setups.
Gold 30-Minute Chart: The Ascending Triangle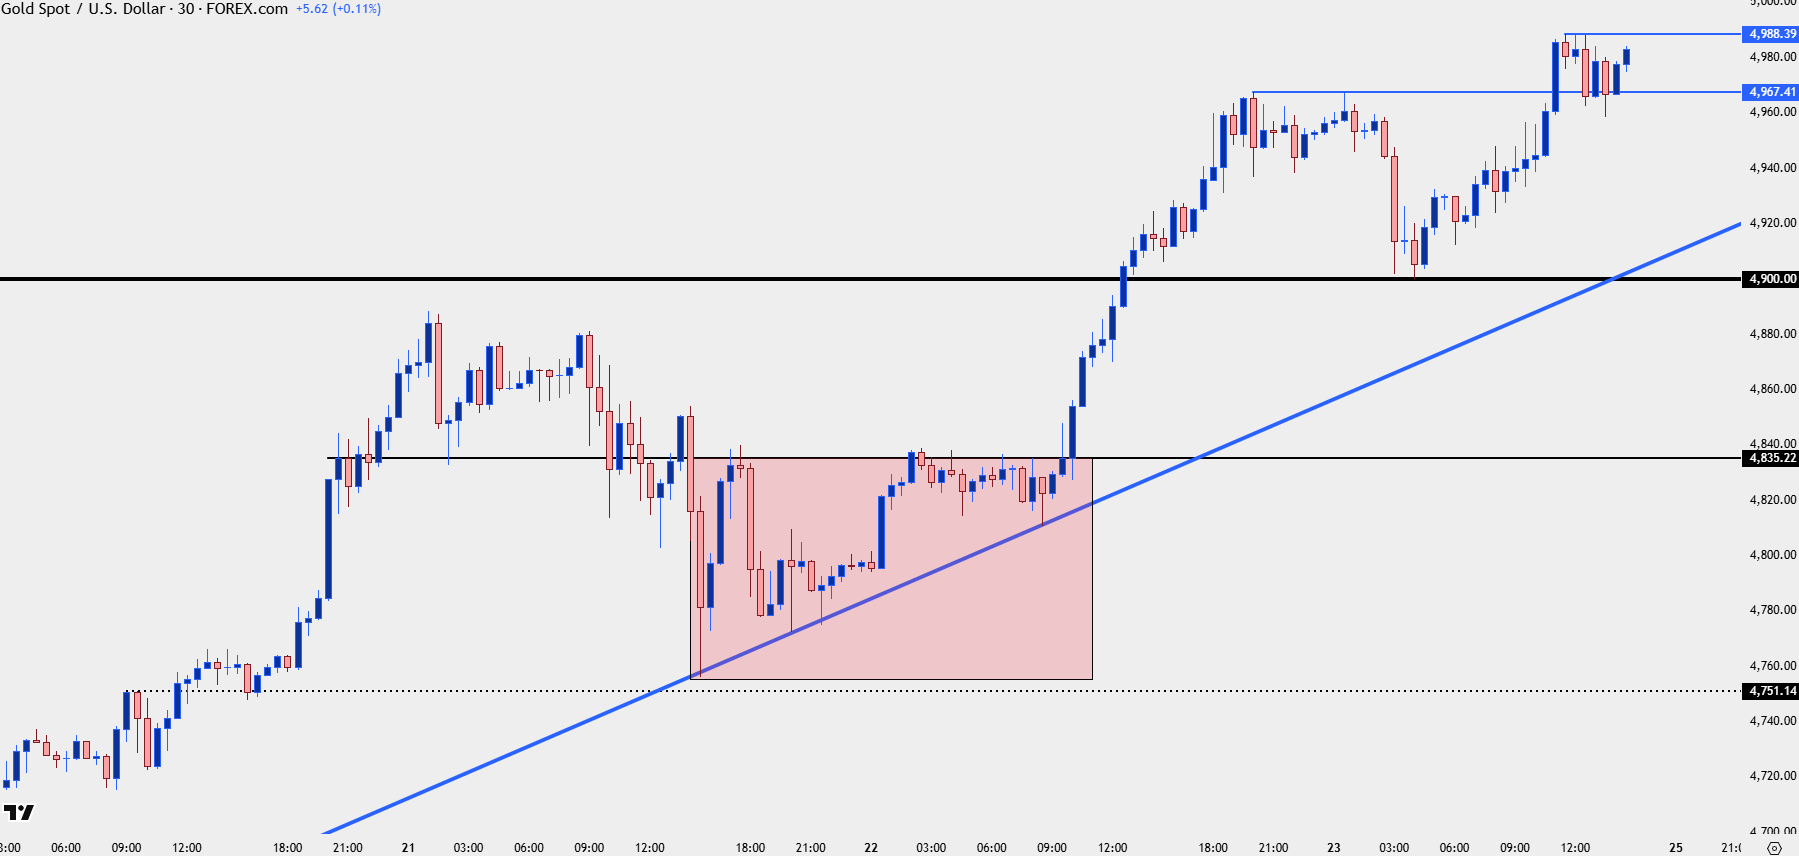
Chart prepared by James Stanley; data derived from Tradingview
Gold Strategy Moving Forward
At this point there’s really just a couple of options for traders and realistically none are perfect. With the $5k/oz level coming into view there’s the very real prospect of stalling on the basis of profit taking, especially after such an aggressive run from around $4402 just a couple weeks ago.
Traders can chase the move which is overbought on longer time frames, which runs the risk of ‘buying a top,’ especially if a wider pullback driven by profit taking shows from a $5k test. Alternatively, traders can wait for a pullback, which may never arrive, and this runs the risk of not participating in the bullish trend but it also affords the opportunity to limit risk to support structure. And a third option is to try to fade the move which can be challenging given just how aggressively the trend has priced in.
My normal path forward is one of patience and the reason for that is that I value my own psychology. If I chase and it doesn’t work out, I bear that blame. If I wait and it doesn’t work out, I can deal with that much better as at the very least, I tried to take a professional and patient approach to the matter. And for fading the trend, I see that as pure guesswork that would need a lot of hope that a $5k test will actually hold the highs. If evidence mounts after a failed run at $5k and if we begin to see a bearish price series, perhaps that situation presents itself. But, as someone that tries to avoid prediction and instead looks for reaction on the basis of market structure, taking such a vivid counter-trend stance isn’t a path I often like to go down.
For next week, there’s a few different spots of possible support on gold and if we do get the pullback after the first $5k hit, this is where I want to read just how bullish buyers remain to be.
The first is $4967 as this held the highs after the late-week breakout. A show of short-term support there can keep the door open for another push up towards the $5k handle. Below that, the $4900 psychological level already came into play as short-term support on Thursday night so that remains of interest, as well, and if bulls fail to hold prices above that, then a deeper pullback looks to be more likely, which then brings on the $4835 level and perhaps even $4751.
If we see prices drop below $4751 next week, the aggressive bullish momentum had clearly turned and that’s the point where reassessment makes sense.
Gold Four-Hour Price Chart
Chart prepared by James Stanley; data derived from Tradingview
--- written by James Stanley, Senior Market Analyst, Global Macro
Related tags:




Open an account in minutes
Experience award-winning platforms with fast and secure execution, and enjoy tight spreads from 0.5 pts on FX and 0.3 pts on indices.
Economic calendar
Web Trader platform
Our sophisticated web-based platform is packed with features.
Related articles

Gold Price Forecast: XAU/USD Plunges 12.4% Toward Critical Support 10 1 2026
Softer inflation has revived expectations for a Fed pause, but Friday’s payrolls could put gold’s recovery prospects to the test.


Gold Price Outlook: XAU/USD Resistance at $4200 Sets Up for NFP
It was a strong sell-off to start the week in gold and despite a Tuesday bounce, sellers are continuing to push following a resistance hit at the $4200 level.

Nasdaq Breakout Potential into Q4 for Melt Up Scenarios
The headlines seem negative in almost any place that you look, with surging Treasury yields and frothy AI valuations getting more and more attention. But, if it’s so bad, why hasn’t the Nasdaq melted down yet, even as the Fed has started hiking rates?
This report is intended for general circulation only. It should not be construed as a recommendation, or an offer (or solicitation of an offer) to buy or sell any financial products. The information provided does not take into account your specific investment objectives, financial situation or particular needs. Before you act on any recommendation that may be contained in this report, independent advice ought to be sought from a financial adviser regarding the suitability of the investment product, taking into account your specific investment objectives, financial situation or particular needs.
StoneX Financial Pte. Ltd., may distribute reports produced by its respective foreign entities or affiliates within the StoneX group of companies or third parties pursuant to an arrangement under Regulation 32C of the Financial Advisers Regulations. Where the report is distributed to a person in Singapore who is not an accredited investor, expert investor or an institutional investor (as defined in the Securities Futures Act), StoneX Financial Pte. Ltd. accepts legal responsibility to such persons for the contents of the report only to the extent required by law. Singapore recipients should contact StoneX Financial Pte. Ltd. at 6826 9988 for matters arising from, or in connection with the report.
In the case of all other recipients of this report, to the extent permitted by applicable laws and regulations neither StoneX Financial Pte. Ltd. nor its associated companies will be responsible or liable for any loss or damage incurred arising out of, or in connection with, any use of the information contained in this report and all such liability is hereby expressly disclaimed. No representation or warranty is made, express or implied, that the content of this report is complete or accurate.
StoneX Financial Pte. Ltd. is not under any obligation to update this report.
Trading CFDs carries a high level of risk that may not be suitable for some investors. Consider your investment objectives, level of experience, financial resources, risk appetite and other relevant circumstances carefully. The possibility exists that you could lose some or all of your investments, including your initial deposits. If in doubt, please seek independent expert advice. Visit www.forex.com/en-sg/terms-and-policies for the complete Risk Disclosure Statement.