



Gold is Back to $4k but is it There to Stay?
Gold broke down from a double top formation and saw selling again yesterday around the FOMC meeting. But a day later it’s back above the $4k level and vying for a bullish breakout.
Share this:

USD strength showed around the FOMC meeting yesterday as Powell didn’t sound as dovish as markets were expecting or hoping for. He wasn’t exactly hawkish but he said that a December rate cut wasn’t a foregone conclusion, and the lack of data from the ongoing government shutdown wasn’t necessarily being construed as an item denoting greater labor market weakness. Gold initially sold off on the back of the FOMC meeting but so far, it’s held a higher-low and is vying for a breakout to get back above the $4k handle.

The gold sell-off all started from a double top formation that broke down last week. Initially, there was clean defense of the $4k psychological level on that pullback, but the bounce simply brought more selling and gold finally pushed below the big figure on Monday of this week. The slide continued through Tuesday night, with a prior point of resistance at $3895 coming in to hold the lows. And while that bounce was also faded, with another push of weakness around the FOMC rate decision yesterday, bulls have been making their way back in, with a higher-low overnight and as of this writing, another push back above the psychologically important $4k level.
Gold Four-Hour Chart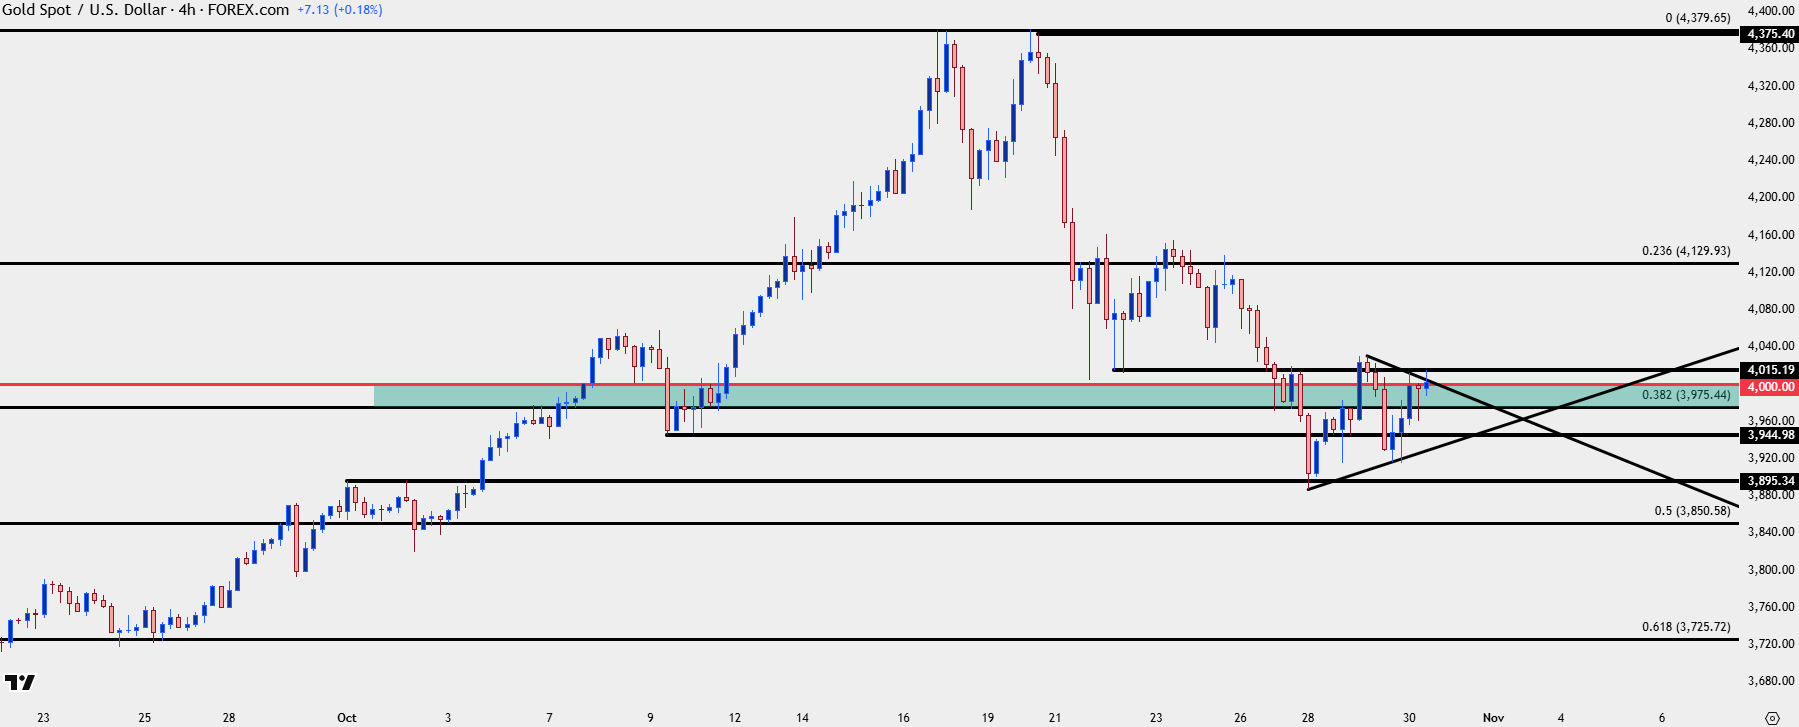
Chart prepared by James Stanley; data derived from Tradingview
Gold Daily
The daily chart of gold can be seen as an early sign of encouragement. While the break and follow-through from the double top formation was quick and aggressive, the elongated wick from Tuesday has so far been followed by a higher-low yesterday and another so far today; and this has to be considered with the fact that the Fed wasn’t overtly dovish at yesterday’s rate decision. The strength shown so far today is a bright spot for bulls, showing that there’s been some value discovery from the 3915 level that’s been tested as the low for the past two days.
The formation over the past three days isn’t quite a morning star formation but it does have a similar three bar sequence highlighting turn potential, where bar one shows an aggressive push of continuation, followed by a degree of indecision on bar two, although this takes on more of a spinning top tone than a doji. And so far bar three is a clear reversal of bar one’s weakness, highlighting that pivot potential.
But, of course, the big question here is whether the $4k level can remain defended and whether buyers are willing to take on exposure above the big figure, which ultimately is what remains as the key test ahead.
Gold Daily Price Chart
Chart prepared by James Stanley; data derived from Tradingview
Gold Shorter-Term
Given the current resistance test, I thought it’d be appropriate to look at the shorter-term dynamics in gold, but this must be qualified by the fact that shorter-terms can often be noisier simply from a smaller sample sizing effect.
Adding a Fibonacci retracement to the recent sell-off can also provide some additional perspective, and it’s the 23.6% retracement that’s currently being tested, also around that $4k level. This becomes a big spot of support potential in breakout scenarios with the next spot of resistance overhead a the $4075 level, and the 50% mark of the recent sell-off is confluent with the 23.6% retracement of the move that started from Jerome Powell’s speech at Jackson Hole. That’s also the site of the lower-high before the $4k break, so this similarly shows as a big spot of resistance potential in bullish scenarios on gold, after which 4075 would be considered as a spot for higher-low support.
Above that, the 4186-4192 area is both a significant swing low, the site of the prior neckline from the double top formation, and also confluent with the 61.8% retracement of the sell-off. That sets up as an ‘r3’ area of resistance for bullish continuation setups.
Gold Hourly Price Chart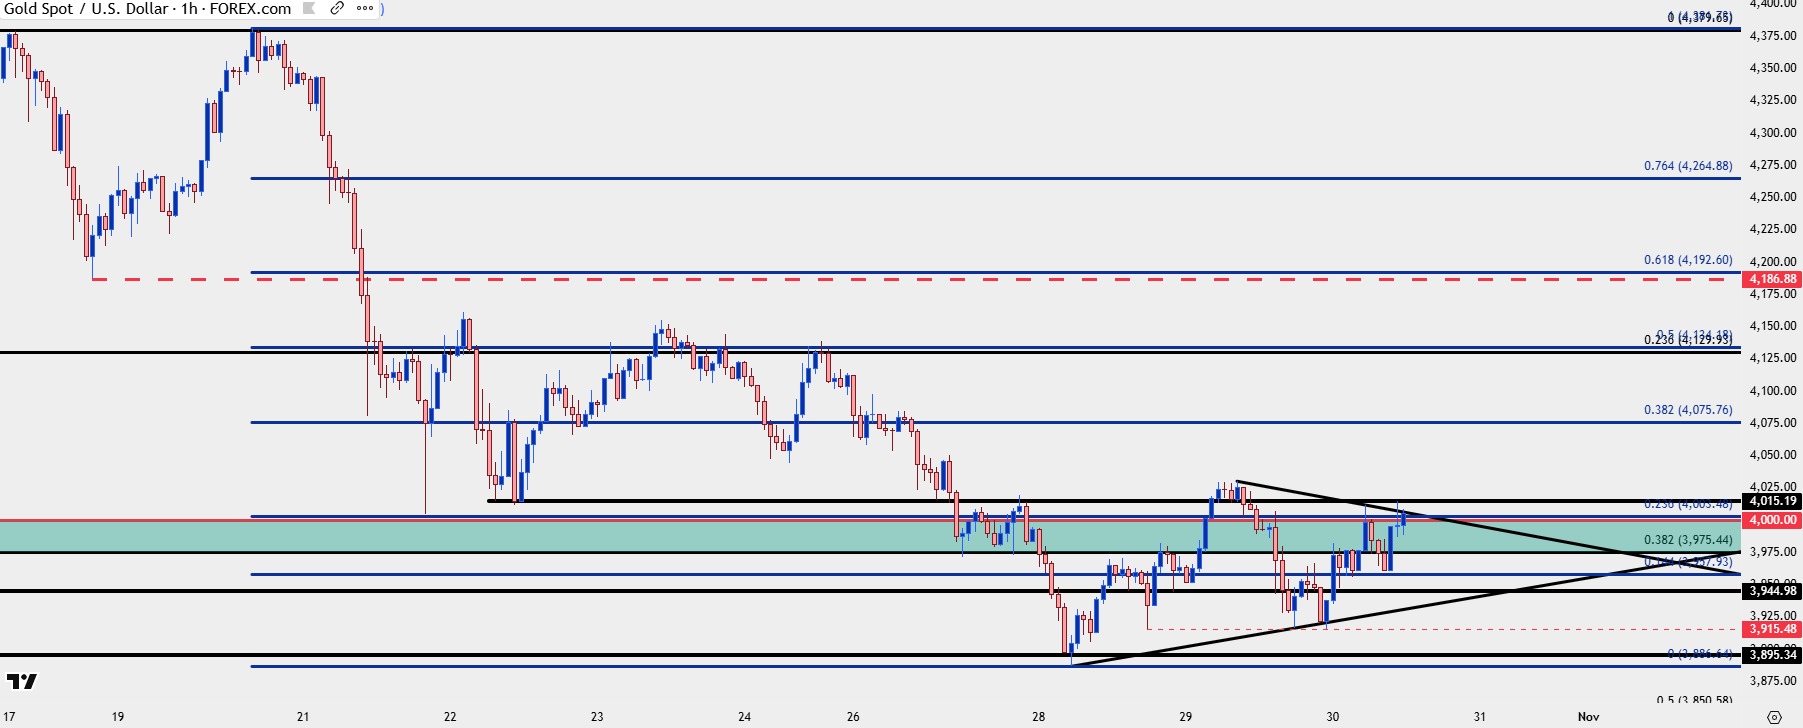
Chart prepared by James Stanley; data derived from Tradingview
--- written by James Stanley, Senior Strategist
Related tags:



Open an account in minutes
Experience award-winning platforms with fast and secure execution, and enjoy tight spreads from 0.5 pts on FX and 0.3 pts on indices.
Economic calendar
Web Trader platform
Our sophisticated web-based platform is packed with features.
Related articles

Gold Price Forecast: XAU/USD Plunges 12.4% Toward Critical Support 10 1 2026
Softer inflation has revived expectations for a Fed pause, but Friday’s payrolls could put gold’s recovery prospects to the test.


Gold Price Outlook: XAU/USD Resistance at $4200 Sets Up for NFP
It was a strong sell-off to start the week in gold and despite a Tuesday bounce, sellers are continuing to push following a resistance hit at the $4200 level.

Nasdaq Breakout Potential into Q4 for Melt Up Scenarios
The headlines seem negative in almost any place that you look, with surging Treasury yields and frothy AI valuations getting more and more attention. But, if it’s so bad, why hasn’t the Nasdaq melted down yet, even as the Fed has started hiking rates?
This report is intended for general circulation only. It should not be construed as a recommendation, or an offer (or solicitation of an offer) to buy or sell any financial products. The information provided does not take into account your specific investment objectives, financial situation or particular needs. Before you act on any recommendation that may be contained in this report, independent advice ought to be sought from a financial adviser regarding the suitability of the investment product, taking into account your specific investment objectives, financial situation or particular needs.
StoneX Financial Pte. Ltd., may distribute reports produced by its respective foreign entities or affiliates within the StoneX group of companies or third parties pursuant to an arrangement under Regulation 32C of the Financial Advisers Regulations. Where the report is distributed to a person in Singapore who is not an accredited investor, expert investor or an institutional investor (as defined in the Securities Futures Act), StoneX Financial Pte. Ltd. accepts legal responsibility to such persons for the contents of the report only to the extent required by law. Singapore recipients should contact StoneX Financial Pte. Ltd. at 6826 9988 for matters arising from, or in connection with the report.
In the case of all other recipients of this report, to the extent permitted by applicable laws and regulations neither StoneX Financial Pte. Ltd. nor its associated companies will be responsible or liable for any loss or damage incurred arising out of, or in connection with, any use of the information contained in this report and all such liability is hereby expressly disclaimed. No representation or warranty is made, express or implied, that the content of this report is complete or accurate.
StoneX Financial Pte. Ltd. is not under any obligation to update this report.
Trading CFDs carries a high level of risk that may not be suitable for some investors. Consider your investment objectives, level of experience, financial resources, risk appetite and other relevant circumstances carefully. The possibility exists that you could lose some or all of your investments, including your initial deposits. If in doubt, please seek independent expert advice. Visit www.forex.com/en-sg/terms-and-policies for the complete Risk Disclosure Statement.