
Gold pulled back aggressively earlier in the week but bulls have already responded with a bounce above the $4k level. This however begs the question as to whether buyers can drive to fresh highs or whether a deeper round of consolidation is due.
Gold was in a parabolic move coming into this week but the 4380 level proved to be a showstopper, as it held the highs last week and then again after this week’s open, building a double top formation. Those are approached with aim of bearish breakdowns and that’s precisely what took hold on Tuesday in one of the largest single-day sell-offs in gold’s history.
So far, the $4k/oz level has remained defended with a tug-of-war showing just above the psychological level from Tuesday night through Wednesday, but the bigger question now is whether the pullback has potential to deepen as profit-taking from the parabolic trend takes over.

It takes just one look at prior parabolic-like instances in gold to see that such a spike can often be followed by prolonged bouts of profit taking. That doesn’t necessarily have to be bearish, however, as the pause in the final two months of last year and then the four-month span this year both showed as bull pennant formations. But, the first ever test of the $2k level was different as prices broke down, drove into a range and then mean reverted for the next three-plus years. There was a reason for that, however, as anti-fiat flows shifted into cryptocurrency and dominantly, Bitcoin, which is another item of consideration given the run on the ‘debasement trade’ that’s shown over the past year.
So the matter up for debate at the present is whether the sell-off that’s shown so far in gold is the start of a larger consolidation or digestion pattern – or whether this was the pullback that didn’t show for much of the almost two-month span of parabolic price action.
The daily chart is more conducive for that push as the two-day sell-off found buyers just above the $4k level. There was a shorter-term double top formation that had set up which I talked about in the Tuesday webinar, and that projected to a move down towards 3994, which was just 0.3% from the low that developed and saw defense.
For dip-buyers, that hold above $4k and corresponding bounce presented a compelling value opportunity. But the question now is whether bullish momentum can take-over again, and that will likely have something to do with whether longer-term bulls will use this bounce to take profits.
Gold Daily Chart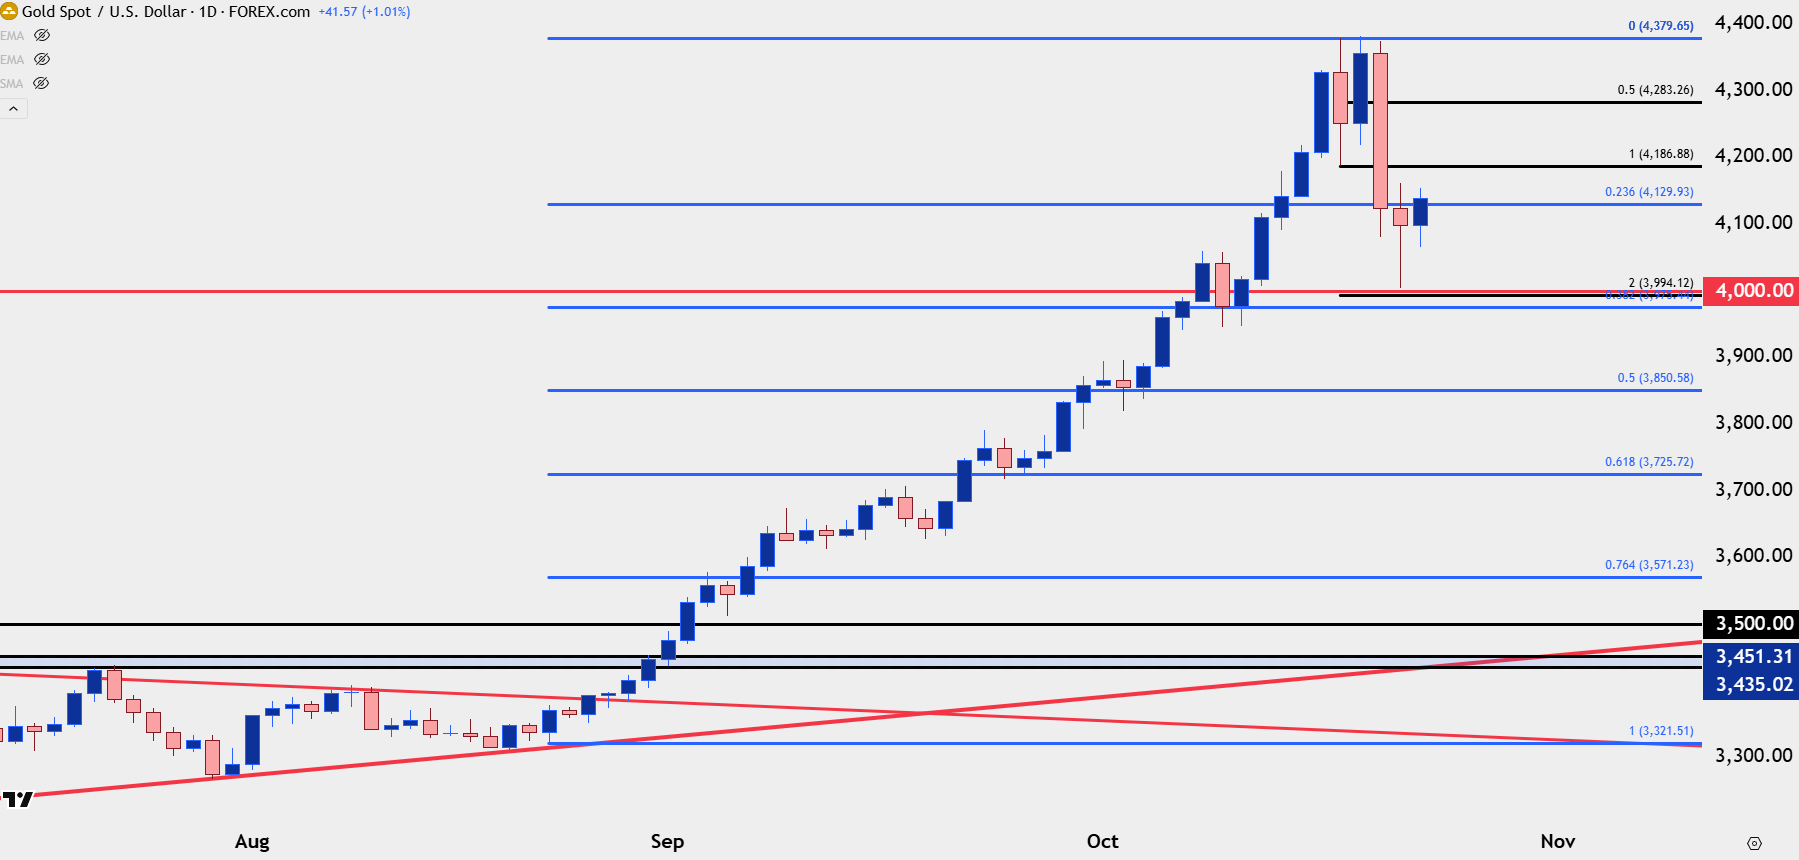
Chart prepared by James Stanley; data derived from Tradingview
Gold Bigger Picture
The way that this week finishes will be important to the longer-term setup on gold. Last week’s close and this week’s open printed near 4250, and if buyers can push above that by the end of the week, especially if they can make a strong push above that price, this longer-term chart will retain a bullish feel, especially given the response from buyers to the early-week sell-off.
But, if we push up to 4250 and close near there, we’ll have a doji on the weekly and that indecision will begin to favor bears. There’s also the 4380 level, which set the shorter-term double top and currently helps to mark the all-time-high for gold. In the bullish scenario, where buyers make a strong late-week push, that price becomes a significant line in the sand with the 4500 level the next obvious spot of major psychological resistance. But, if we close as a doji, there’s the first two steps of an evening star formation setting up, and that’s something that would point to the possibility of a $4k re-test and there’s no significant support below that until we get to prior resistance of $3500.
Gold Weekly Chart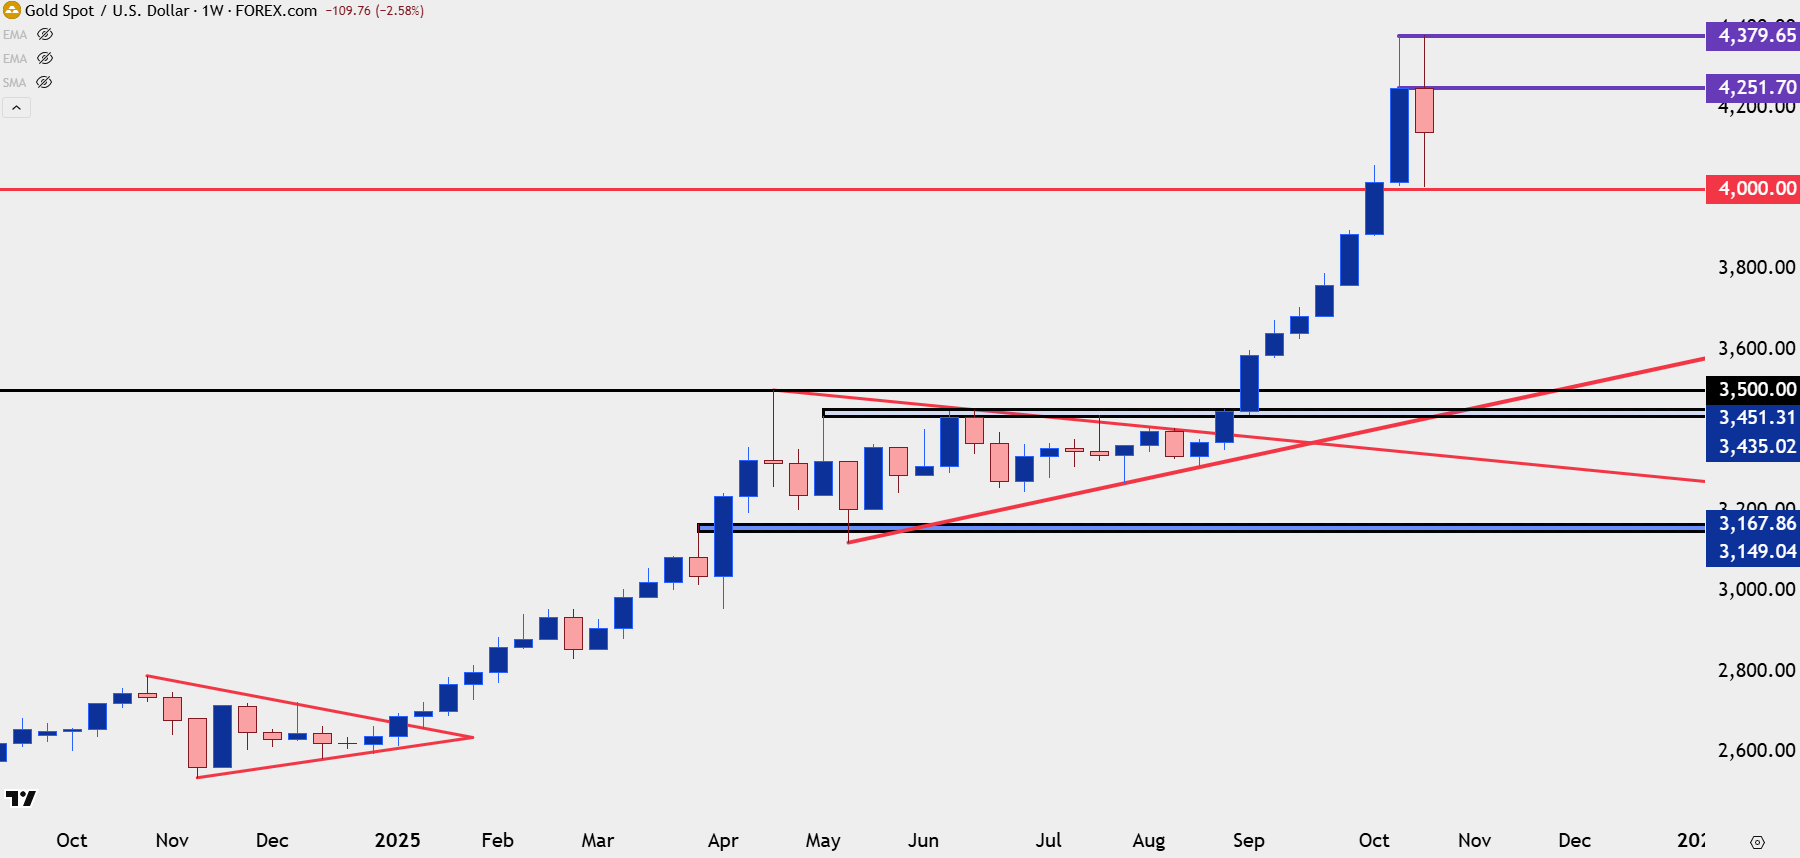
Chart prepared by James Stanley; data derived from Tradingview
Gold Shorter-Term
With buyers returning yesterday following that hold above $4k, short-term trends have begun to tilt-higher and I have three areas inside of that 4250 level to consider for resistance potential. The first is nearing at 4167-4180, and that’s followed by a spot of resistance turned support around the 4200 psychological level. And above that, I’m tracking the zone from 4242-4246 as an ‘r3’ area of resistance for gold.
For longs that rode the excursion down to the $4k bounce, each of those zones can present compelling areas to take profit and similarly, for buyers that got in around the $4k test, each zone is an attractive area to take profits from short-term setups.
Regarding strategy, I had looked at this premise last week before the reversal had started to show, and while the jury remains out on whether this is a small pullback or the start of a longer round of consolidation, for strategy purposes, the path forward can be simplified. A test or hold of support opens the door for relatively small risk outlays given the potential for bullish trend resumption. So, finding those supports or working with those supports on a shorter-term basis becomes the path forward for bulls looking to push resumption, as chasing breakouts, even after this week’s pullback, can be a daunting way to establish exposure into a move that’s shown extreme volatility of recent.
For that, there’s now support potential at 4314, which would be an aggressive hold, and then the 4080-4100 zone that was short-term resistance turned support.
Gold Four-Hour Price Chart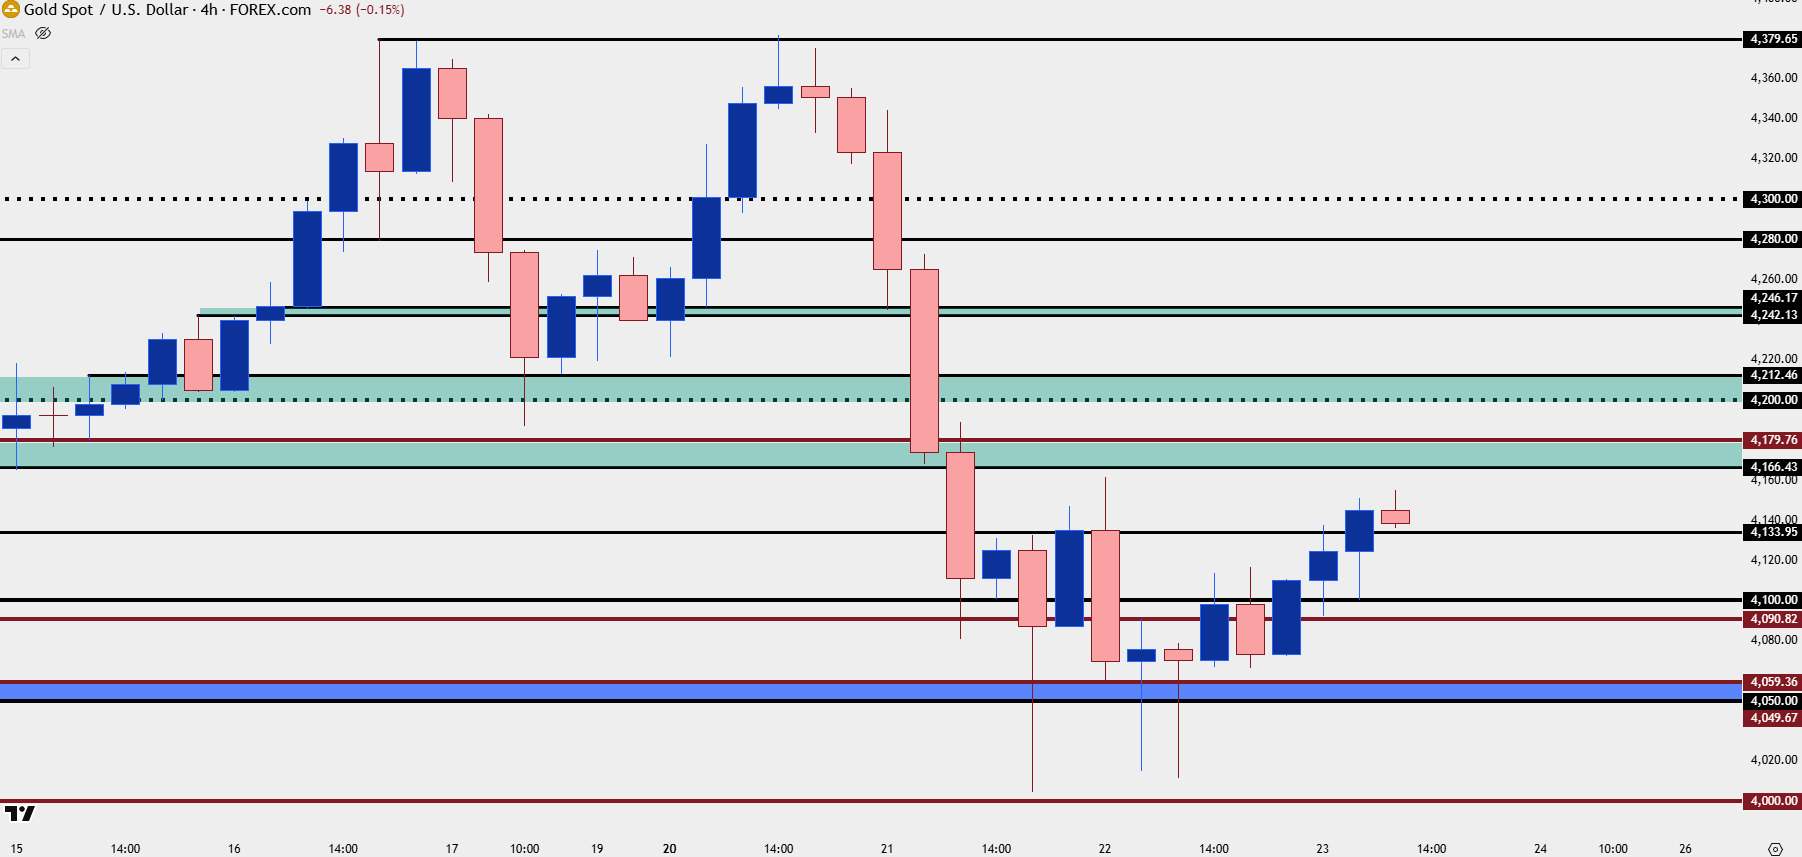
Chart prepared by James Stanley; data derived from Tradingview
--- written by James Stanley, Senior Strategist