

- The rally in gold has remained in a parabolic state since launching out of the bull pennant formation in late August.
- These moves can be surprisingly difficult to work with given the one-sided trend, but in this article, I’ll look at a way of doing so using multiple time frame analysis.
The rally in gold prices just keeps running higher and at this point even the most ardent of bears should’ve questioned their thesis along the way. It was just a week ago that gold didn’t look so certain about the $4k/oz level. But a pullback to support at $3950 got bulls back in-charge, and they haven’t looked back since, forcing a rally above the $4250 level and the metal is now fast approaching the next psychological waypoint at $4300.
This illustrates one of the drawbacks of technical analysis in that it can never show you how long a trend may run. It can highlight a budding reversal or a possible pullback, it can help to demarcate significant lines in the sand for support and resistance, which are key for imparting strategy in a risk-efficient manner. But, by definition, technical analysis involves examining the past and as any trader should know well, the past does not perfectly predict the future.
This is one of the reasons that I’ve remained so bullish on gold for well more than a year now. The rally that stated from Austan Goolsbee’s ‘let’s not get flipped out’ comment in February of 2024 triggered a parabolic run in gold that’s only taken a temporary pause on two occasions. And in each, the technical backdrop retained a bullish lean, as the build of bull pennants kept the bias looking higher.
Technical analysis can provide two important elements to traders: The first and perhaps most important for biasing, is trend identification. Trends happen, and there’s usually a reason for them. The second and this is more important to strategy, is the existence and importance of support and resistance, which can help to read and acknowledge the first element of trend identification.
In a strong market, buyers will show up to defend support at higher-lows. In a weakening market or an overbought market, that support can begin to wane. And in a reversal market, sellers start to take over and they show this by driving aggressively through support, and then offering the market lower at lower and lower highs.
In gold, however, bulls have remained aggressive with only minor pullbacks along the way. And from the daily chart, there remains a parabolic-like move that can be difficult to work with from a longer-term perspective, given that lack of two-sided price action.
The first bull pennant formed in the last two months of 2024, and started just before the US Presidential election. Gold digested for two months and then broke out aggressively in early-2025 trade. But, as looked at last week, this seemed to have a Bitcoin component to it as anti-fiat flows drove more aggressively into the cryptocurrency as gold took a breather.
The 2025 rally then ran all the way to $3500, at which point another pause began to show and, again, this took on the form of a bull pennant formation. That one lasted for about four months and all the way until Jerome Powell’s speech at Jackson Hole, at which point gold went parabolic and hasn’t really looked back, save for some short-term pullbacks that bulls have quickly pounced on.
Gold Daily Price Chart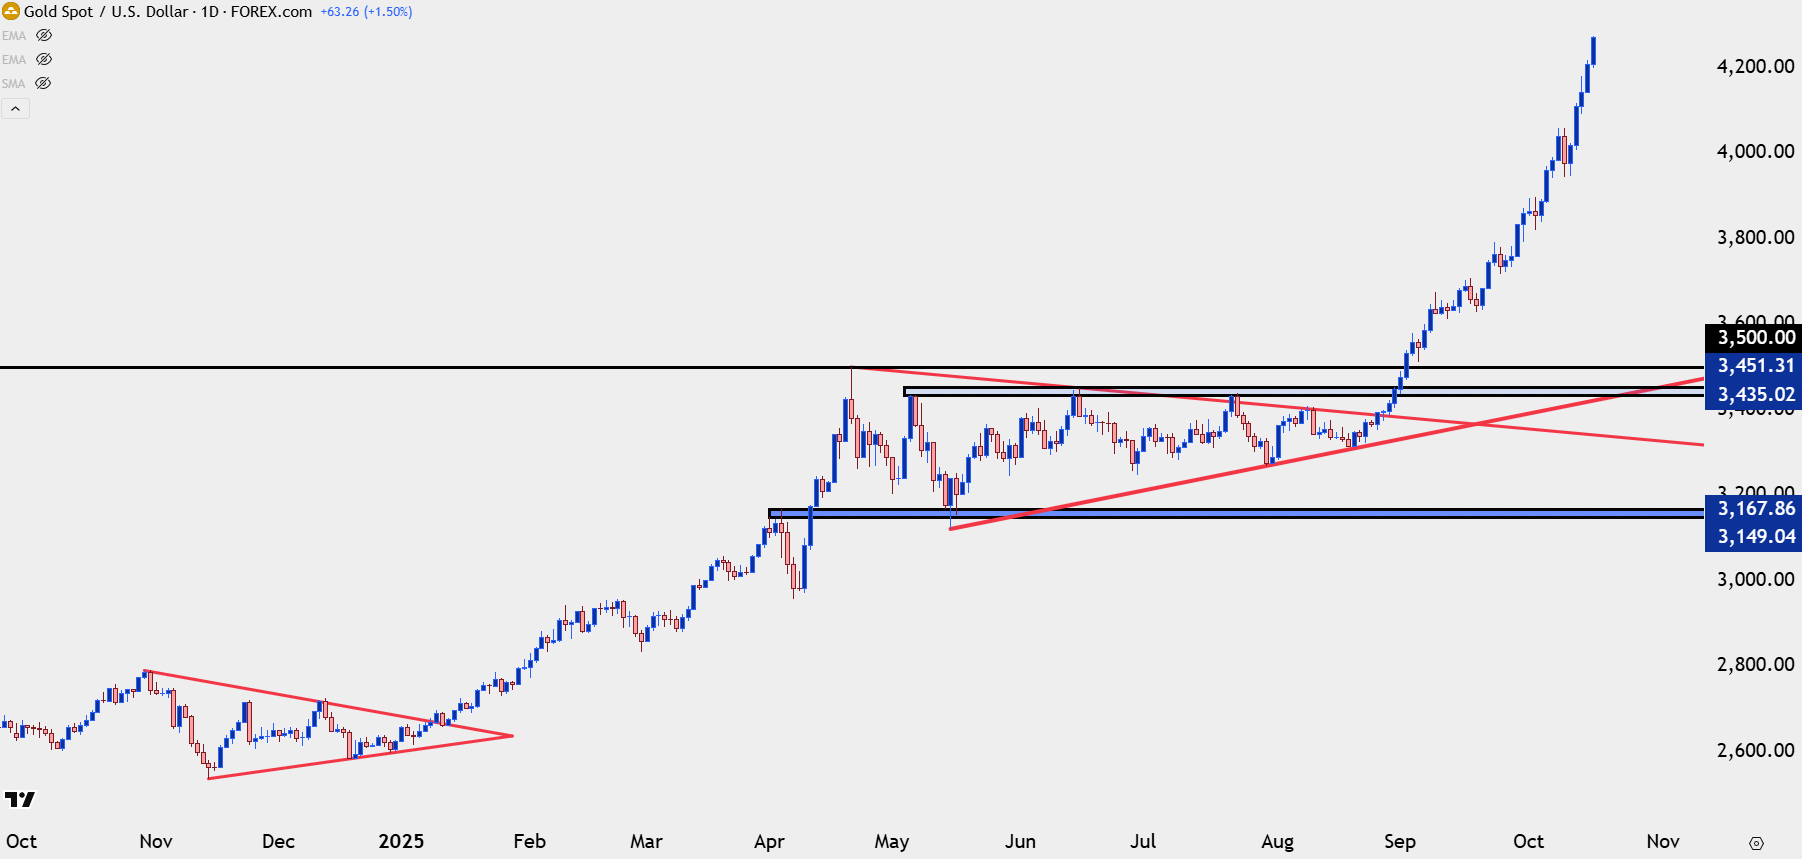
Chart prepared by James Stanley; data derived from Tradingview
How to Work with Parabolic Trends
The trader’s option set in such environments isn’t great, but it largely revolves around the choice as to whether they should chase the move and risk getting caught buying a top, or wait for a pullback that may never arrive. The downside of each is fairly clear, however, as the former involves a loss of capital while the latter is only a loss of opportunity. I think with experience, most trades will side with the missed opportunity cost because with patience, more opportunity will arrive, while lost capital is gone forever.
But there could possibly be a way of trying to negotiate between these two pathways by using a shorter-term chart to look for pullbacks, so that risk can be concentrated; and if we do see that parabolic trend continue, the trader can work with the prevailing bias in the market as prices push to fresh highs.
This is largely what I have been discussing on webinars around the topic of gold as there’s been very little in pullback over the past two months. And, paradoxically, it’s when those bullish digestion formations form, such as we saw in the four-month period from the April high to the August breakout, that traders seem to be at their most bearish, driven by the thought that the strong rally in gold must face some form of pullback given just how massively it has priced in.
But traders should be careful with that because, again, the past does not predict the future. I think the most we can expect from technical analysis is the usage of history in effort of imparting strategy, such as looking for a prior area of resistance to come in as fresh support. Or by looking for a major psychological level to show some element of defense, as buyers show up to pounce on a ‘perceived value’ when prices test below a big figure.
On the below hourly chart I’ve identified three areas of support potential. Key for each would be an actual show of support at the zone before looking for bullish continuation, so this would involve underside wicks on the shorter-term chart to illustrate buyers showing up and reacting to the zone in-play at the time. And if that does show – the door opens for continuation potential. If we see all three zones taken out, then we might finally see some element of pullback in the broader trend, similar to those digestion formations looked at above, and that’s something that can involve a larger pullback that wouldn’t necessarily negate the big picture up-trend that’s held in gold going on two years now.
Gold Hourly Price Chart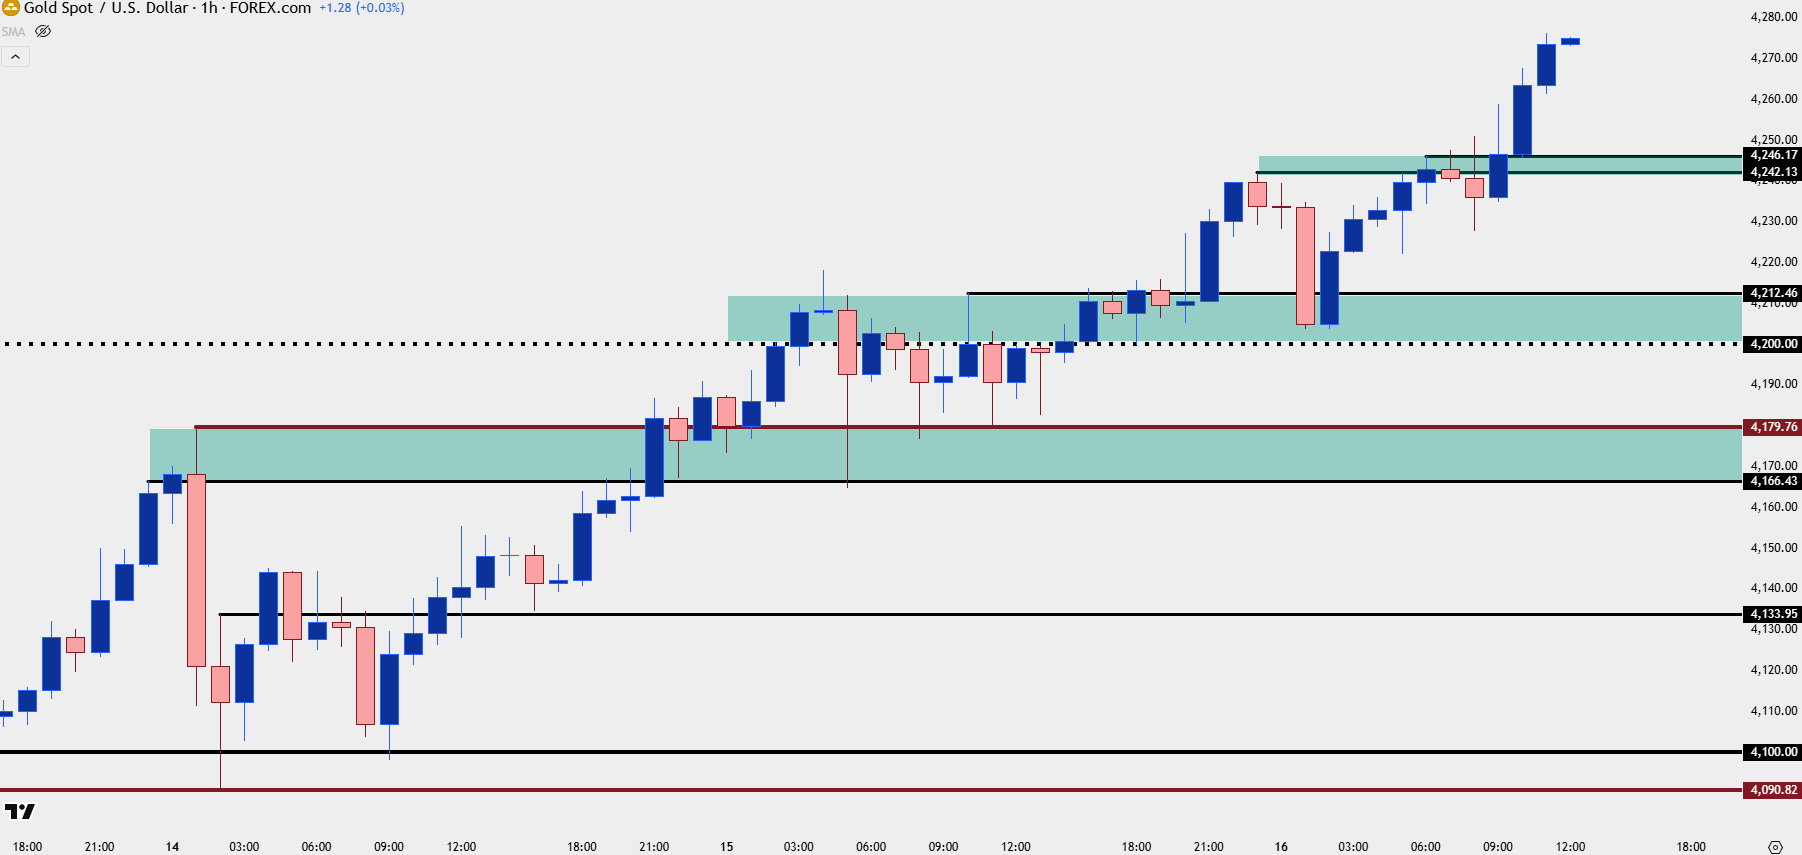
Chart prepared by James Stanley; data derived from Tradingview
--- written by James Stanley, Senior Strategist