



Gold’s Breakout Represents a Potentially Massive Macro Shift
Gold prices broke out in a very big way this week following months of support at or around the $4k level. The big question now is whether that shift shows across the macro landscape.
Share this:

Gold Talking Points:
- After a rough six-month outing gold prices rallied in a very big way over the past week.
- With a weekly gain over 7% as of this writing, it’s the largest such move since January, just before the metal had topped-out, begging the question as to whether buyers are in control and, if so, might that shift have carryover to other markets such as stocks or Treasuries.

After coming into the year with a full head of steam, gold spent much of the past six months in varying forms of distress. But, along the way, it built a falling wedge pattern – which is often approached with the aim of bullish reversals. And over the past week, that is what has so far shown up, as buyers took a step forward in a big way, and prices are re-testing a prior point of resistance that had previously held the highs back in October of last year.
Gold Weekly Chart – The Breakout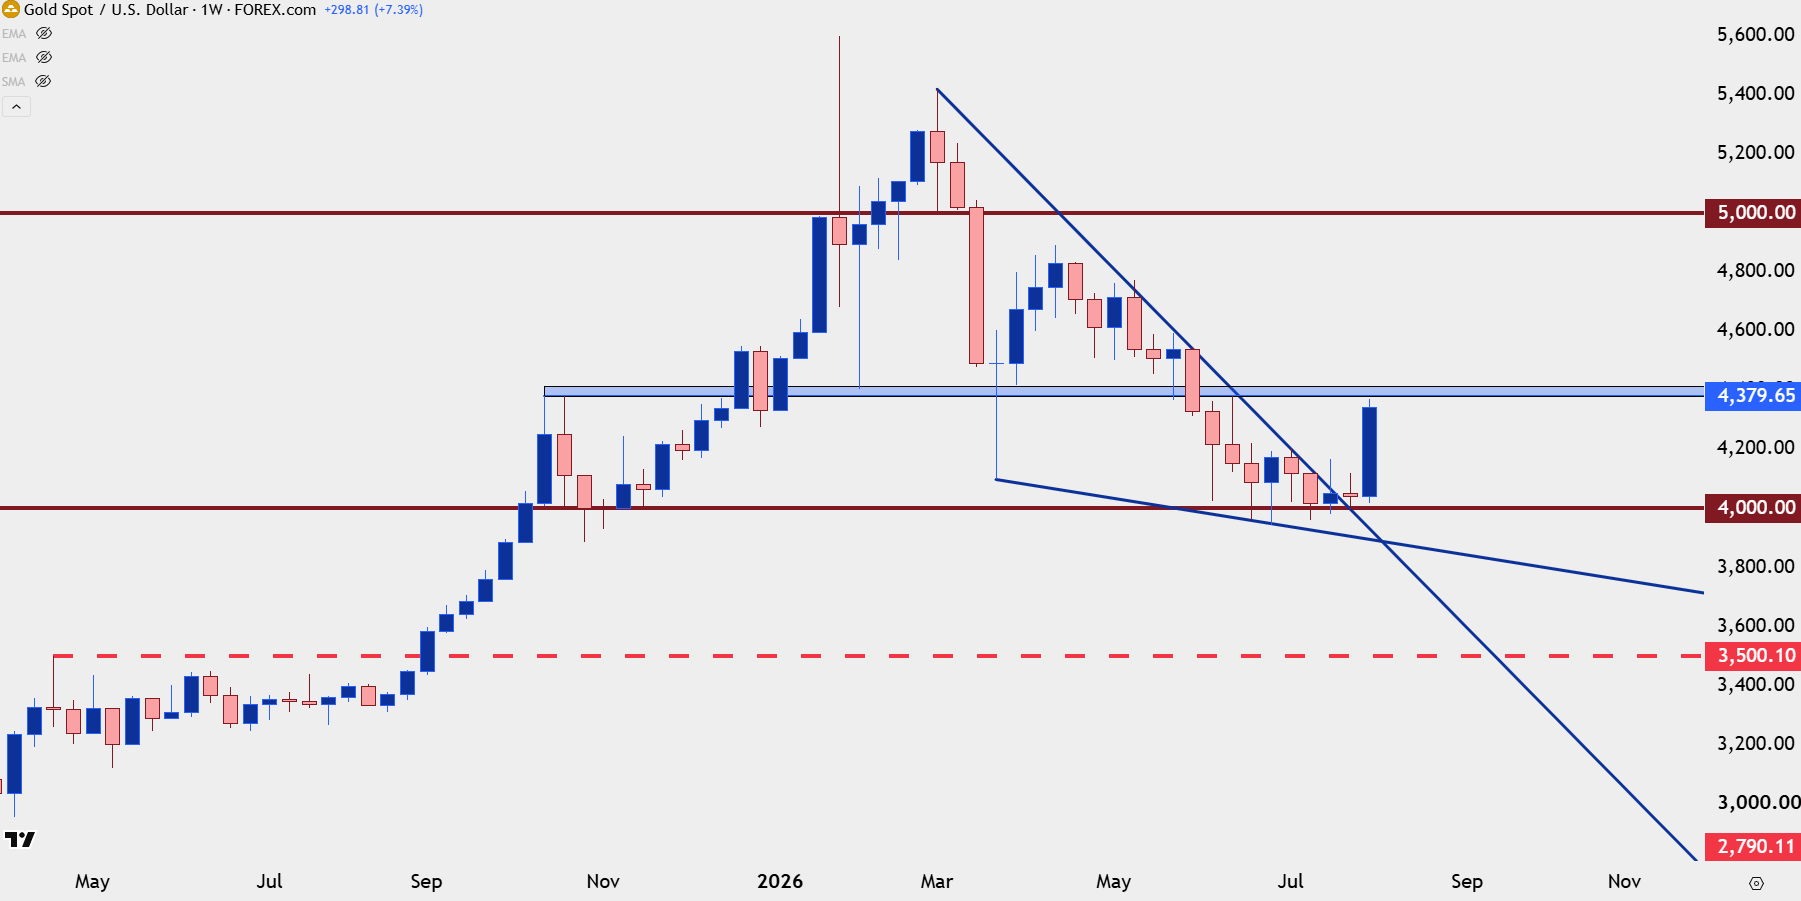
Chart prepared by James Stanley; data derived from Tradingview
What’s Behind the Drive?
I looked at this in the five charts for the week ahead video for StoneX, and I’ve linked that below, but my opinion is that gold is looking or trying to look around the next corner. And after Kevin Warsh seemed to talk a big game on being hawkish at last week’s FOMC meeting without any actual follow-through, gold markets are moving on the basis of a less-hawkish Fed. Now, this doesn’t mean that there won’t be fracture, as we saw at last month’s vote with three dissents actually looking for a hike. And since then, we’ve heard from other Fed members like Paulson or Cook that sounds as though they could also be in that dissent camp voting for a hike before too long.
But, from where we’re at now, it looks as though that inflationary pressure may not be as strong as it was a month or two ago, and this puts perhaps even more pressure on the CPI report for next week.
Gold Leads the Top 5 Charts for Next Week
This content was created by an affiliate of FOREX.com and represents the views and opinions of the author/speakers, not the views and opinions of Forex.com, StoneX Group Inc., or its subsidiaries. The content has not been independently reviewed by FOREX.com.
Gold Structure
At this point the daily chart shows the theme quite cleanly, as the sell-off of lower-lows and lower-highs ran into consolidation through the month of July. Notably – the metal had held above $4k until just after the June FOMC meeting when the bank sounded hawkish and that’s ultimately what brought the test of the big figure in.
It’s the last part of that statement that is most important, as this signified a change-of-pace, which also showed on the weekly chart with the past two weeks showing as higher-lows. And then after this week’s open, bulls wouldn’t even allow for a $4k re-test, as support played at the familiar level of $4023 before the breakout ramped up in a big way.
Also notable from the daily chart is how those prior lower-highs during the consolidation phase now set up as possible higher-lows for the bullish trend scenario.
Gold Daily Chart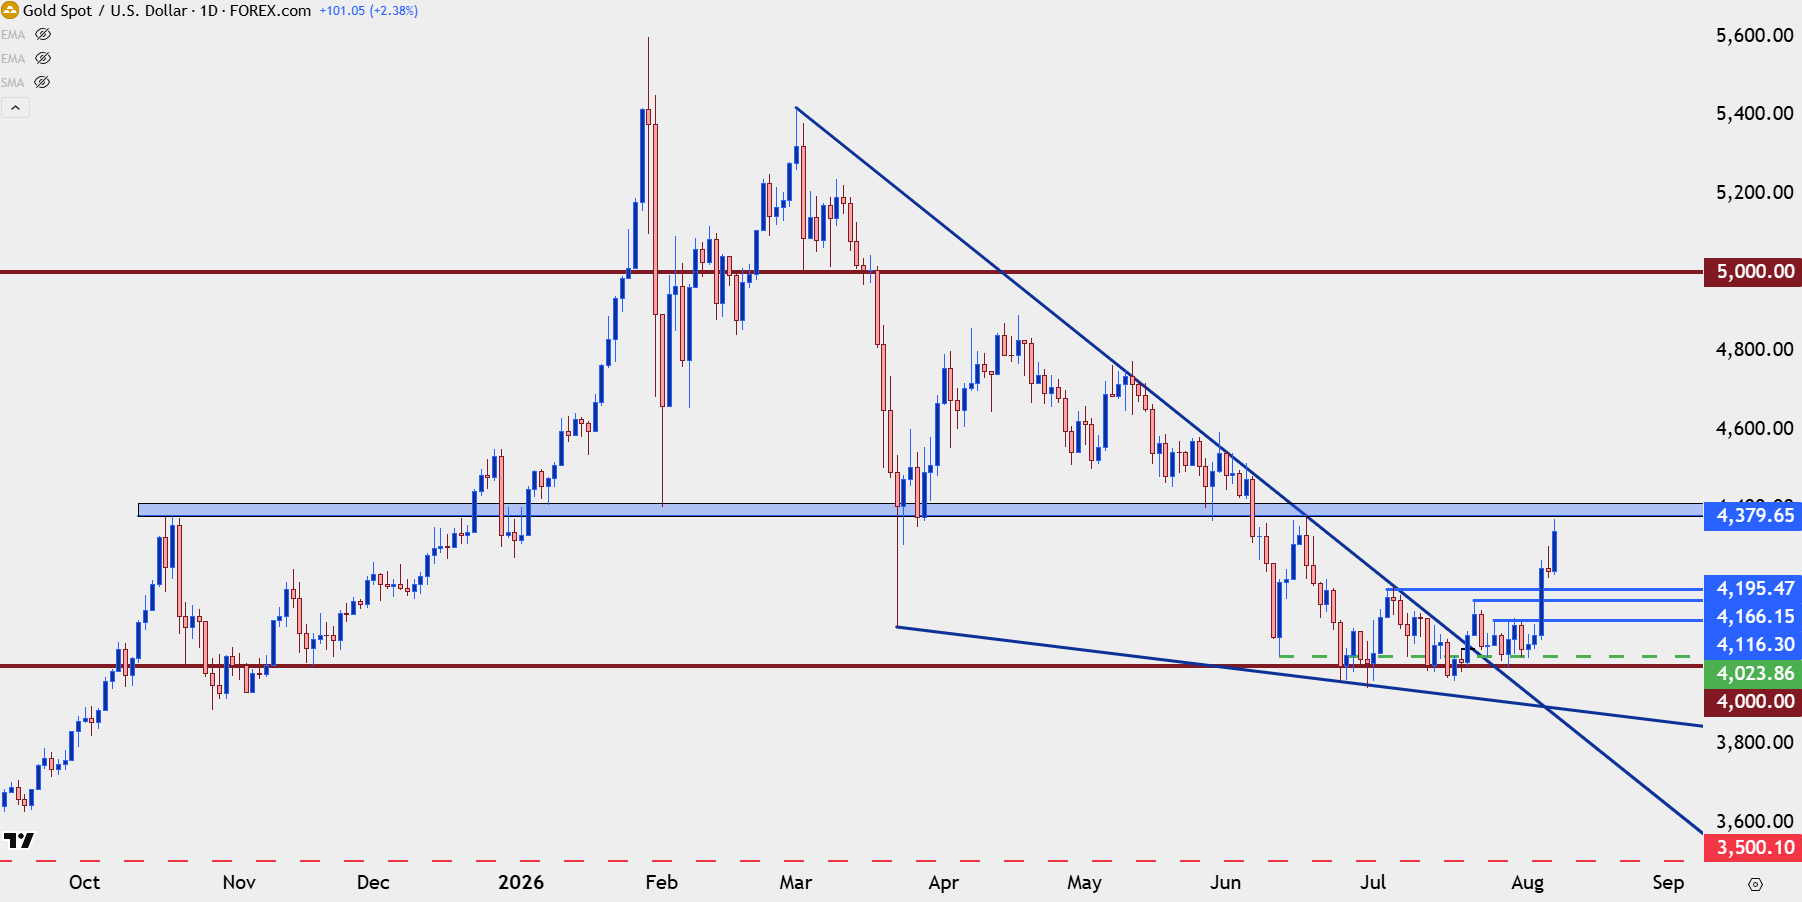
Chart prepared by James Stanley; data derived from Tradingview
Gold Near-Term Strategy
The below four-hour chart is the one that I had shared in the above video, and given how strong the bullish move priced-in, there’s a few different scenarios worth entertaining.
Ideally, bullish momentum would remain so aggressive that pullbacks are mild or moderate, but given the intensity of the CPI release next week, the realm of possible setups should be widened. For nearby supports, both $4300 and $4250 stand out, as does the $4200-$4220 zone.
But, should profit taking drive a deeper pullback, support from around $4160-$4180 could be workable, as could the $4100-$4116 zone.
If buyers fail to hold the move for an almost $300 pullback, it’ll start to look like bulls had failed to take advantage of that rally.
Gold Four-Hour Chart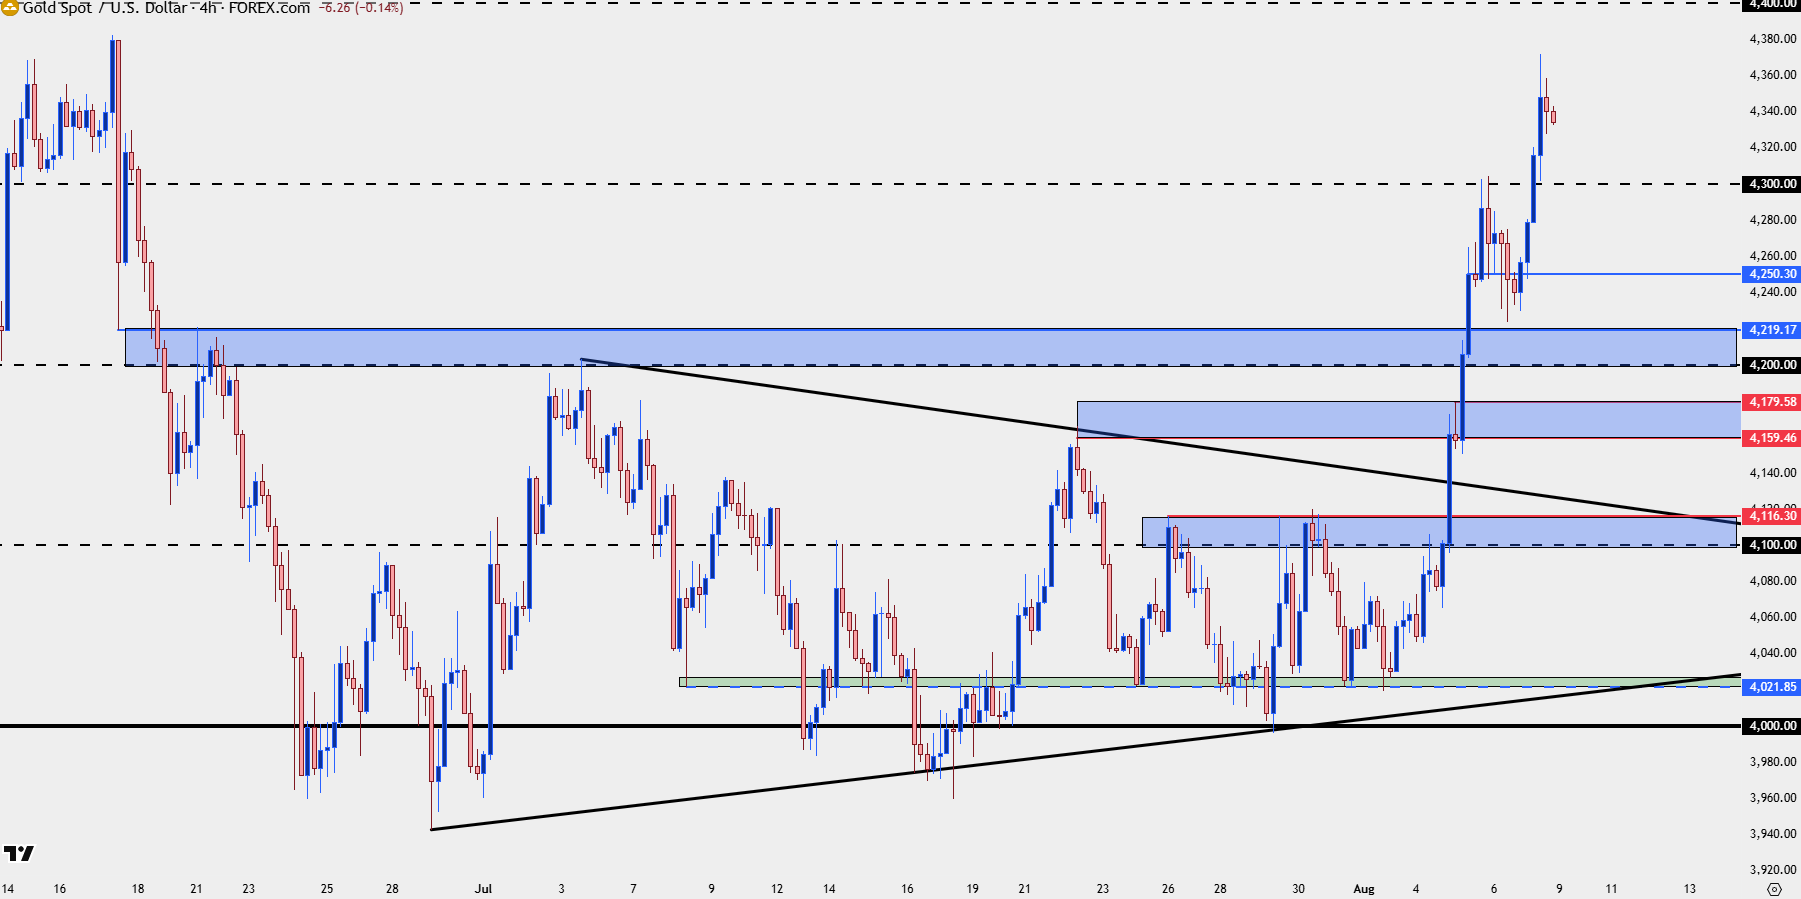
Chart prepared by James Stanley; data derived from Tradingview
--- written by James Stanley, Senior Market Analyst, Global Macro
Related tags:
Latest market news



Open an account in minutes
Experience award-winning platforms with fast and secure execution, and enjoy tight spreads from 0.5 pts on FX and 0.3 pts on indices.
Economic calendar
Web Trader platform
Our sophisticated web-based platform is packed with features.
Related articles
Gold Price Forecast: XAU/USD Avoids Breakdown as Yields Surged but Can it Continue?
Surging Treasury yields sent a jolt across markets last week but, so far, gold prices have held above the FOMC low. The big question now is whether that can continue and, if not, will bulls show up at $4100 or $4k like they did in June and July?
Gold Q4 2026 outlook: Resilience in the face of rallying dollar and yields
As we headed towards the latter stages of Q3 and into Q4, the Fed had just hiked rates in a hawkish FOMC meeting, while the likes of the ECB and BoJ had also tightened their respective policies. Oil prices remained elevated amid the prolonged US-Iran conflict. Meanwhile, bond yields were breaking out, and the dollar was higher across the board. Yet, remarkably, gold was still holding in the positive territory for the third quarter, even if it had weakened somewhat in September.

Equity Indices Q4, 2026 Outlook: Cracks Begin to Show
There's still an open door for a melt-up in the S&P 500 and Nasdaq but the Dow and Russell 2000 are looking more vulnerable, and until calm hits the Treasuries market there's a higher probability for volatility. The big question is whether that's a next quarter theme or not.
This report is intended for general circulation only. It should not be construed as a recommendation, or an offer (or solicitation of an offer) to buy or sell any financial products. The information provided does not take into account your specific investment objectives, financial situation or particular needs. Before you act on any recommendation that may be contained in this report, independent advice ought to be sought from a financial adviser regarding the suitability of the investment product, taking into account your specific investment objectives, financial situation or particular needs.
StoneX Financial Pte. Ltd., may distribute reports produced by its respective foreign entities or affiliates within the StoneX group of companies or third parties pursuant to an arrangement under Regulation 32C of the Financial Advisers Regulations. Where the report is distributed to a person in Singapore who is not an accredited investor, expert investor or an institutional investor (as defined in the Securities Futures Act), StoneX Financial Pte. Ltd. accepts legal responsibility to such persons for the contents of the report only to the extent required by law. Singapore recipients should contact StoneX Financial Pte. Ltd. at 6826 9988 for matters arising from, or in connection with the report.
In the case of all other recipients of this report, to the extent permitted by applicable laws and regulations neither StoneX Financial Pte. Ltd. nor its associated companies will be responsible or liable for any loss or damage incurred arising out of, or in connection with, any use of the information contained in this report and all such liability is hereby expressly disclaimed. No representation or warranty is made, express or implied, that the content of this report is complete or accurate.
StoneX Financial Pte. Ltd. is not under any obligation to update this report.
Trading CFDs carries a high level of risk that may not be suitable for some investors. Consider your investment objectives, level of experience, financial resources, risk appetite and other relevant circumstances carefully. The possibility exists that you could lose some or all of your investments, including your initial deposits. If in doubt, please seek independent expert advice. Visit www.forex.com/en-sg/terms-and-policies for the complete Risk Disclosure Statement.