



Japanese yen outlook: USD/JPY drivers scrambled by tariffs and geopolitics
Just as USD/JPY was beginning to show signs of a cleaner macro narrative, a fresh wave of uncertainty has complicated the picture. With several potential volatility catalysts looming, traders may find clarity harder to find in the sessions ahead.
Share this:

- Tariff ruling muddies macro signals
- Correlations hint at regime instability
- Fed pricing shifts as cut bets trimmed
- BOJ speakers and Tokyo CPI loom
- Nvidia earnings and geopolitics add curveballs
Summary
Just as USD/JPY looked to be drifting back towards a simpler macro narrative, fresh policy shocks and geopolitical risks have thrown that stability into doubt. With multiple catalysts capable of unsettling yields and risk sentiment, traders face a far less forgiving backdrop. Stay alert.
Markets revert to uncertainty mode
The macro backdrop for USD/JPY shifted abruptly following last week’s tariff ruling, reintroducing uncertainty just as conditions had started to stabilise.
The U.S. Supreme Court’s decision against the administration’s reciprocal tariff framework has altered the policy landscape, clouding the outlook for trade, fiscal assumptions and broader sentiment. President Trump’s swift response, including the signing of a blanket 10% tariff on imports, has done little to ease those concerns, reinforcing the sense that policy uncertainty remains a key market influence.
The immediate challenge is how other nations respond. Whether trading partners accept the shift or pursue retaliatory measures remains unclear, reviving trade tensions at a time when investors had begun to dial back that risk. That uncertainty complicates what had started to look like a cleaner macro environment.
The administration appears confident the new tariff regime can help plug the budget hole, but the revenue outlook remains far from certain. Questions also linger around potential refunds tied to earlier IEEPA tariffs, raising the risk that fiscal pressures may intensify rather than ease. The prospect of fresh legal challenges only adds to the ambiguity.
All of this has implications for the long end of the Treasury curve. Any reassessment of fiscal risks or revenue assumptions carries the potential to lift longer-dated yields, creating an additional layer of uncertainty for assets priced off these rates. Against that backdrop, risk appetite may struggle to gain firm footing, particularly if higher yields begin to exert pressure across other asset classes.
The unstable correlation problem
What happened on Friday has complicated what were tentative signs that USD/JPY was reverting to the rates-driven, risk proxy play it has been known for during lengthy periods in the past.
The correlation matrix below maps USD/JPY against several key market measures, including Fed rate cut pricing for 2026 derived from the shape of the futures curve, US-Japan two-year and 10-year yield differentials, Nasdaq futures, VIX futures, and the shape of Japan’s 2s30s curve.

Source: TradingView
Across the past week, the relationships look relatively clean, with USD/JPY tracking yield differentials closely, particularly across the front end and benchmark 10-year tenor. The correlation with Nasdaq futures has also strengthened, reinforcing the impression that traditional macro drivers were regaining influence over price action.
However, that signal becomes far less convincing once the time horizon is extended. Across the past month, correlations weaken noticeably, while a quarterly view continues to highlight the broader instability that has characterised the pair for some time. While correlations over this longer window remain modest, an important shift had emerged with the relationship between USD/JPY and both two-year and 10-year yield spreads recently flipping back into positive territory, consistent with tentative signs of a reversion towards more familiar historical drivers.
The shift in Japan’s 2s30s curve is also notable. Having acted as a dominant influence following the Japanese election, the relationship has since moved to strongly negative, suggesting U.S. factors have reasserted control as local political uncertainty faded.
Taken together, the message is straightforward: while short-term price action has recently reflected the influence of traditional macro drivers, there is now little certainty the reconnection will last.
When data competes with headlines
Attention now turns to the event calendar, testing whether traditional macro drivers reassert themselves.

Source: TradingView (US Eastern Time)
From a Japan perspective, traders will hear from the BOJ’s most hawkish board member Takada late Wednesday US time, with Himino also scheduled to speak early the following week. That’s an unusual clustering of BOJ commentary, raising the question of whether policymakers may be laying the groundwork for a move in March or April.
Inflation data will also be closely watched. Tokyo CPI for February lands Friday morning in Asia. With markets still debating the scope for further BOJ tightening this year, it is notable how quickly disinflation has re-emerged in annual price measures, driven largely by softer energy prices and government subsidies. The BOJ’s preferred core gauge, excluding fresh food, is expected to rise just 1.7% year-on-year, below the 2% target. A downside surprise could quickly weigh on tightening expectations and pressure the yen, while an upside surprise may carry greater influence if inflation accelerates relative to January levels.
Source: TradingView
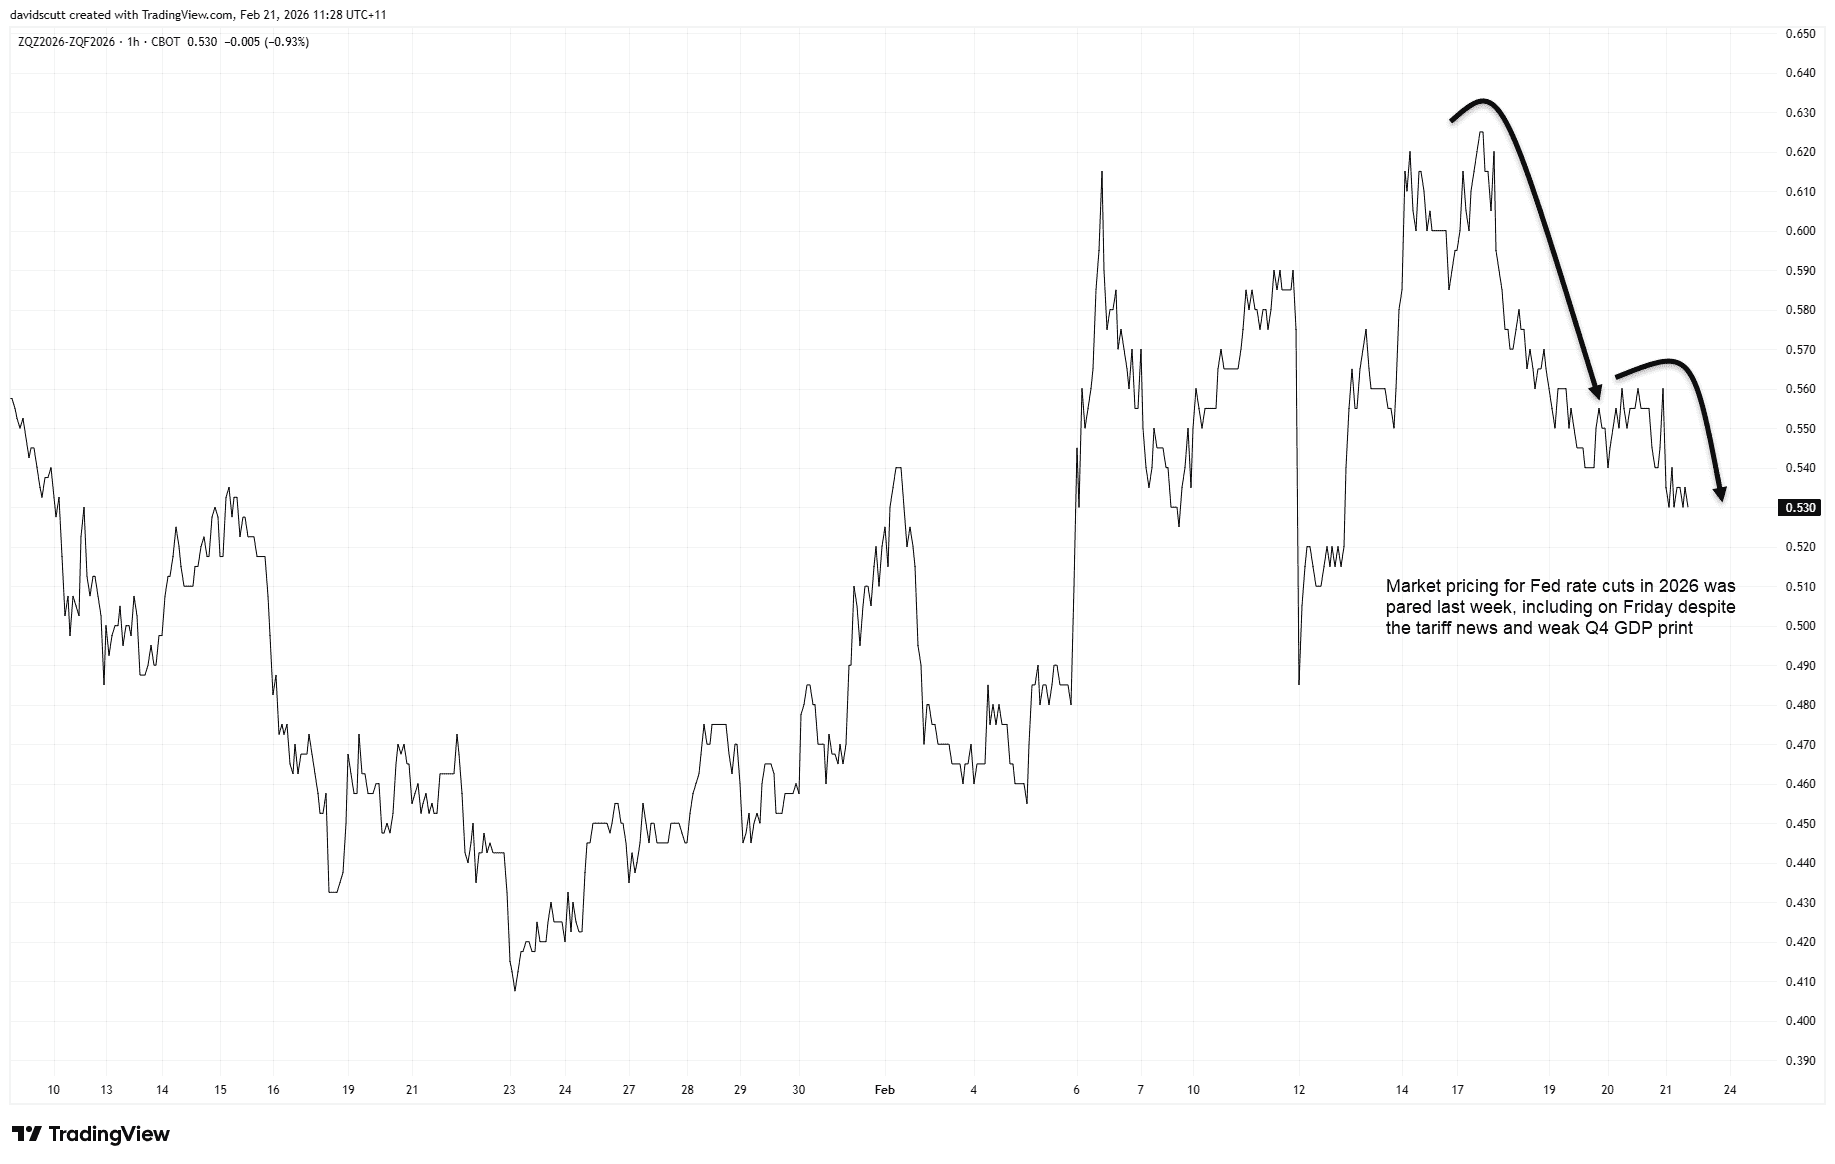
In the United States, the data calendar remains largely second tier until the January PPI report. While rarely a clean market mover in isolation, components of the release feed directly into the core PCE deflator, the Fed’s preferred inflation measure. The broader focus also sits with Fed commentary after rate cut pricing was pared back sharply last week, with markets now expecting just 53 basis points of easing this year. Waller and Bowman, in particular, warrant attention given their prior influence on rate expectations.
Carry trades face external threats
Geopolitical risks also remain on the radar. While President Trump issued Iran with a 10-day deadline to strike a deal late last week, we all know conflict could arrive at any time given prior form. Past flare-ups have tended to generate only limited market reactions, largely because they have not resulted in sustained escalation or broader regional conflict.
From a USD/JPY perspective, there are two competing forces I’m watching. Any prolonged disruption to energy supply would typically favour dollar strength and yen weakness, given the United States’ relative energy self-sufficiency and Japan’s heavy reliance on imports. However, a sharp deterioration in risk sentiment could trigger defensive positioning and carry trade unwinds, an environment that has historically supported the yen.
Unless tensions escalate materially and begin to weigh heavily on broader risk appetite, I suspect the impact on USD/JPY may prove limited beyond any initial knee-jerk reaction.
Nvidia’s Q4 earnings report also remains on the radar, arriving after the U.S. close on Wednesday. While the company has rarely disappointed, limiting the impact of recent releases on FX markets, concerns around AI capex spending and valuation sensitivity mean any negative surprise could spill over into risk sentiment and carry trades.
USD/JPY coils beneath resistance
Source: TradingView
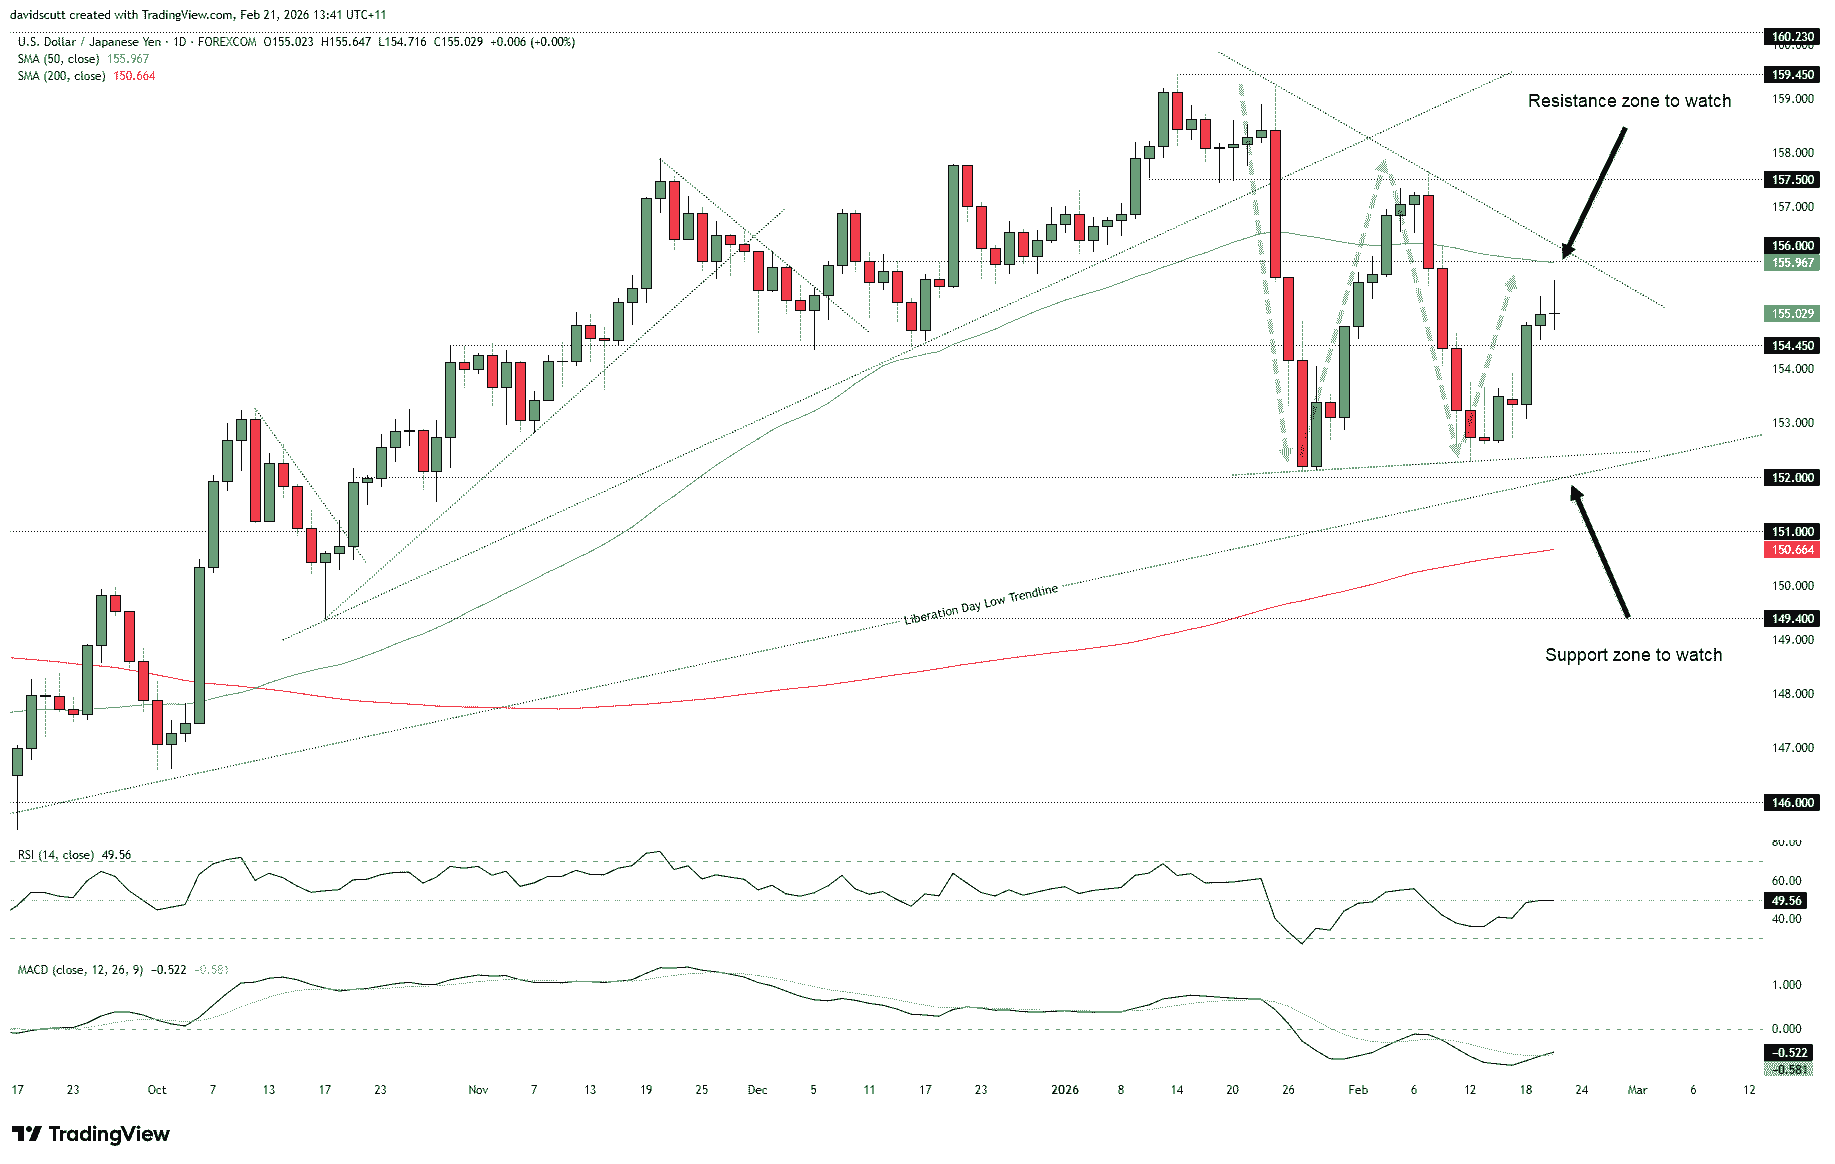
As flagged last week, there was no clear negative catalyst early in the week for bears to attempt a break of the key support zone around 152.00, a region reinforced by both horizontal support and the uptrend dating back to the post-Liberation Day risk rout lows seen in April last year. With risk appetite improving as the week progressed, the pair staged a bounce, pushing back above 154.45 and leaving price perched beneath a notable resistance zone around 156.00, closely aligned with the 50-day moving average.
Price action is also beginning to show signs of compression. The recent sequence of higher lows and lower highs points to a coiling pattern consistent with a developing triangle structure. While the trendlines drawn capture this behaviour, the limited number of touches means they serve more as a visual guide than definitive support or resistance levels.
Against the more complicated macro backdrop, and with headwinds for risk appetite building, directional risks still appear skewed sideways to lower. Last week’s move higher looks corrective following the sharp decline seen in the prior week rather than signalling a broader shift in trend.
The near-term topside focus sits with the resistance zone around 156.00. A break above this region would challenge the current bias, while a move through the February highs above 157.50 would invalidate it entirely. On the downside, 154.45 and 152.00 remain the key levels to monitor.
Momentum signals offer little clarity. RSI (14) and MACD both sit in largely neutral territory, providing no strong directional cues. The doji print on Friday was also consistent with prevailing indecision.
Latest market news




Open an account in minutes
Experience award-winning platforms with fast and secure execution, and enjoy tight spreads from 0.5 pts on FX and 0.3 pts on indices.
Economic calendar
Web Trader platform
Our sophisticated web-based platform is packed with features.
Related articles
Gold Analysis: Resilient U.S. Labor Market Continues to Pressure XAU/USD
Recent trading sessions have not been particularly favorable for gold in the short term. XAU/USD has fallen nearly 2.5% over the last three sessions, reflecting that selling pressure is once again gaining relevance and that the metal continues to struggle to regain momentum.
US Dollar Short-term Outlook: USD Rally on the Line as Midterms, NFP Loom 11 3 2026
DXY is testing pivotal support, with the weekly range breakout likely to determine the next major leg of the trend as key event risk unfolds.

USD/JPY Analysis: Rising U.S. Yields Leave the Yen on the Defensive
As the first week of November progresses, renewed weakness in the Japanese yen is once again becoming evident in the short term. This dynamic can be seen in the recent performance of USD/JPY, which has posted two consecutive bullish sessions and gained more than 0.7%, reflecting a return of buying interest in the dollar while the yen continues to lose momentum.
This report is intended for general circulation only. It should not be construed as a recommendation, or an offer (or solicitation of an offer) to buy or sell any financial products. The information provided does not take into account your specific investment objectives, financial situation or particular needs. Before you act on any recommendation that may be contained in this report, independent advice ought to be sought from a financial adviser regarding the suitability of the investment product, taking into account your specific investment objectives, financial situation or particular needs.
StoneX Financial Pte. Ltd., may distribute reports produced by its respective foreign entities or affiliates within the StoneX group of companies or third parties pursuant to an arrangement under Regulation 32C of the Financial Advisers Regulations. Where the report is distributed to a person in Singapore who is not an accredited investor, expert investor or an institutional investor (as defined in the Securities Futures Act), StoneX Financial Pte. Ltd. accepts legal responsibility to such persons for the contents of the report only to the extent required by law. Singapore recipients should contact StoneX Financial Pte. Ltd. at 6826 9988 for matters arising from, or in connection with the report.
In the case of all other recipients of this report, to the extent permitted by applicable laws and regulations neither StoneX Financial Pte. Ltd. nor its associated companies will be responsible or liable for any loss or damage incurred arising out of, or in connection with, any use of the information contained in this report and all such liability is hereby expressly disclaimed. No representation or warranty is made, express or implied, that the content of this report is complete or accurate.
StoneX Financial Pte. Ltd. is not under any obligation to update this report.
Trading CFDs carries a high level of risk that may not be suitable for some investors. Consider your investment objectives, level of experience, financial resources, risk appetite and other relevant circumstances carefully. The possibility exists that you could lose some or all of your investments, including your initial deposits. If in doubt, please seek independent expert advice. Visit www.forex.com/en-sg/terms-and-policies for the complete Risk Disclosure Statement.