





Look to EURAUD and EURNZD for Stock Market Direction
If you are looking to see why stock indices have turned, look to the EUR/AUD and EUR/NZD.
Share this:

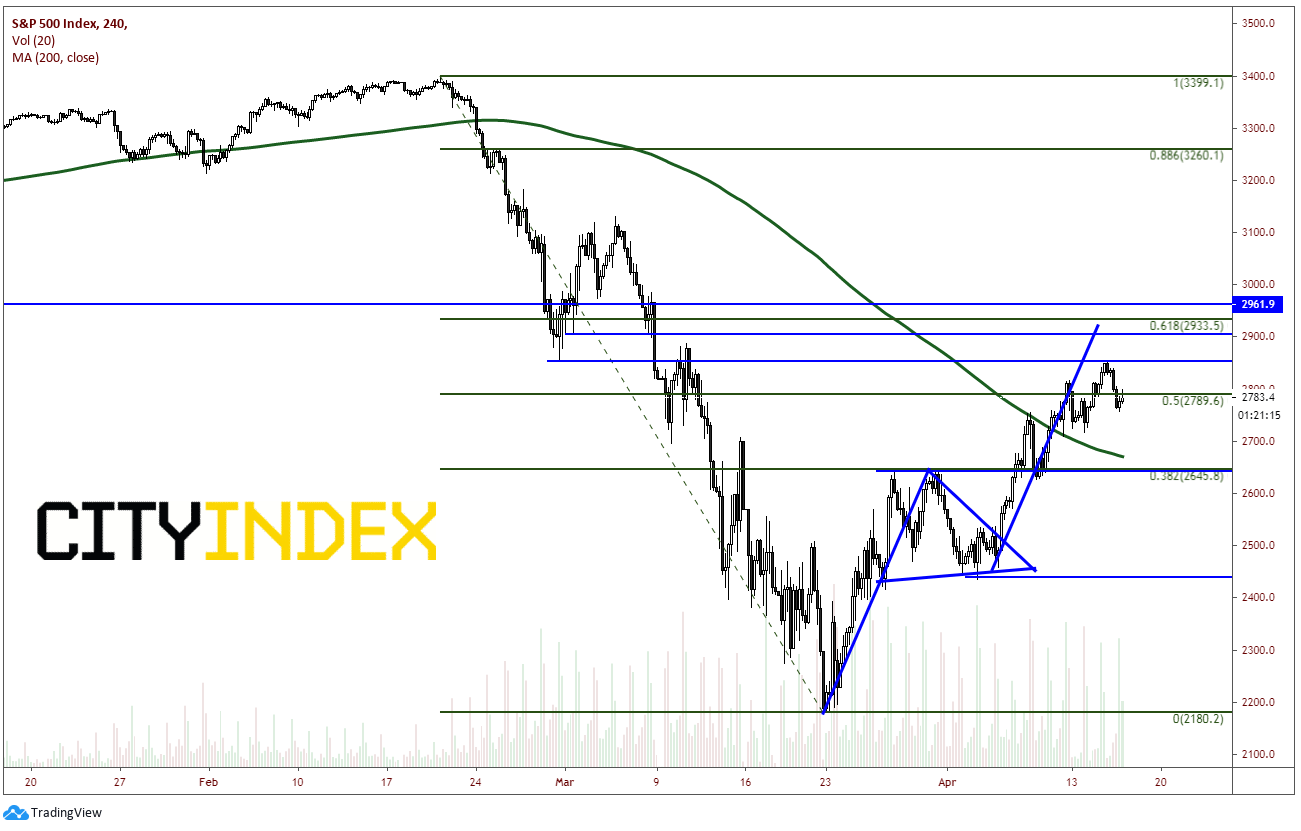
After putting in a low on March 23rd, the S&P 500 has been moving aggressively higher, only pausing at the 38.2% Fibonacci retracement level from the February 20th highs to the March 23rd lows. It broke out of a pennant formation on the move higher which targeted near 2900/2925, near horizontal resistance and the 61.8% Fibonacci retracement level of the previously mentioned timeframe. Today, price halted at minor horizontal resistance and moved lower to test yesterday’s daily low and put in an ominous, dark candlestick.
Source: Tradingview, CME, City Index
So, the question to ask now is: Why did stocks stop moving higher HERE? Was it the minor horizontal resistance? Was it the expectations of weaker data (the move started overnight)? Was it more bad coronavirus news? Sometimes we don’t know, and that’s ok. But we should always be looking for clues as to why, so that when we see it again, we may already have an answer!
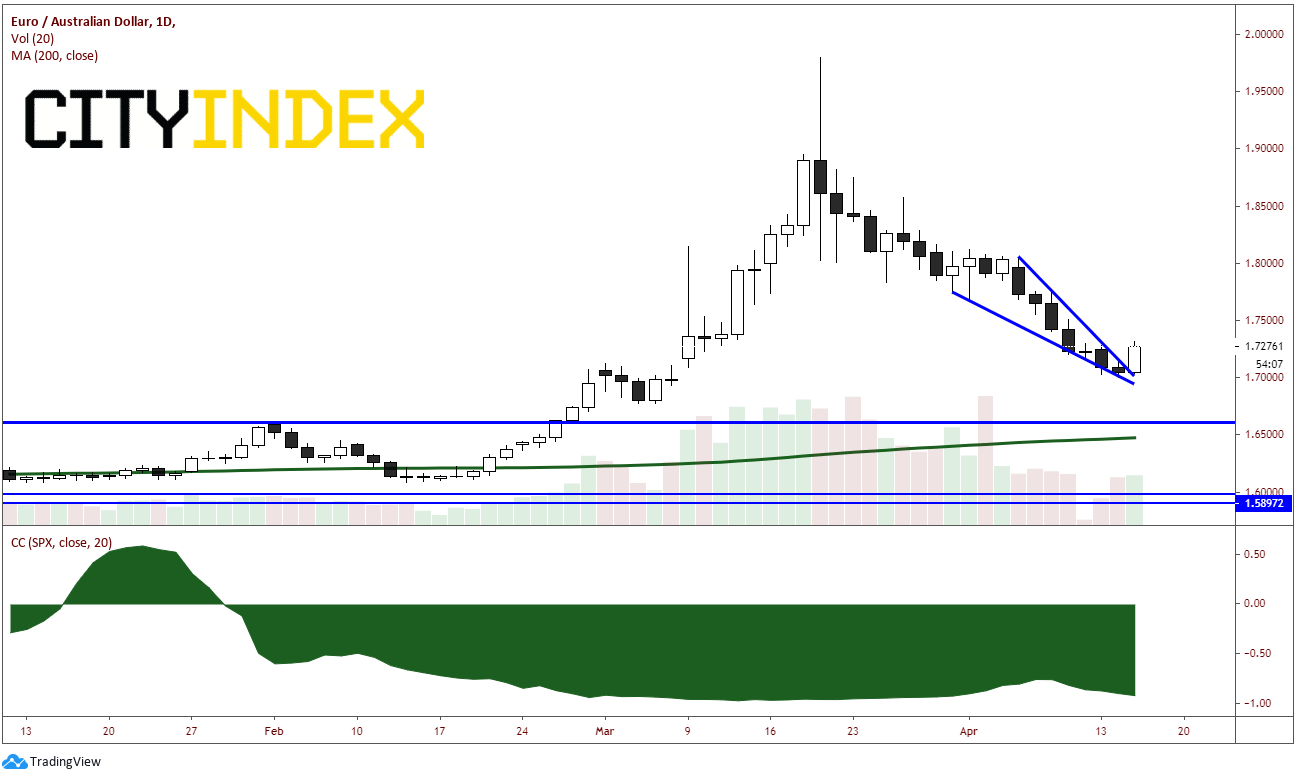
Let’s look at EUR/AUD. The currency pair is highly negatively correlated with the S&P 500. That is, when the EUR/AUD moves in one direction, the S&P 500 moves in the opposite direction. The current correlation coefficient is -0.92. With this context in mind, the price movement of the pair has formed a descending wedge and has broken higher today. The target of a descending wedge is a 100% retracement of the wedge, which is near 1.8000. Therefore, because of strong correlation, if EUR/AUD is breaking higher, the S&P 500 should be moving lower.
Source: Tradingview, City Index
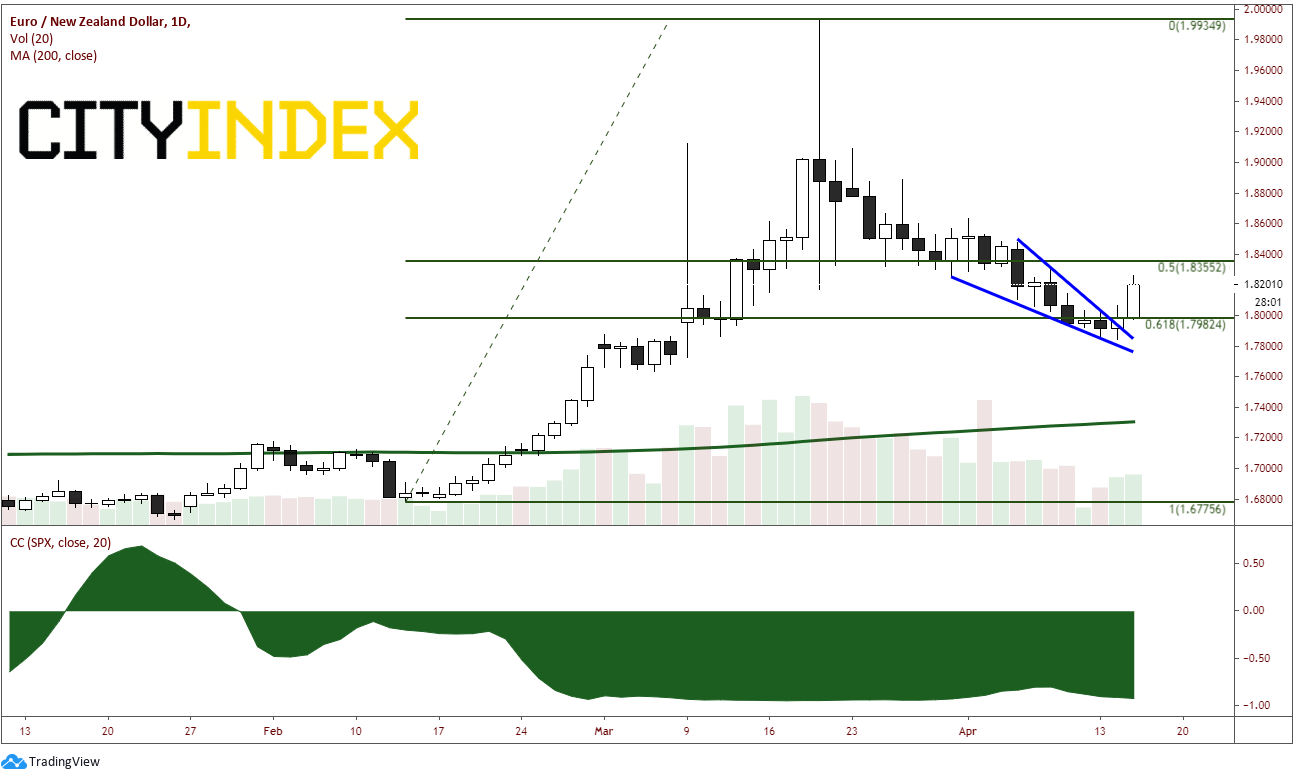
Now let’s similarly look at EUR/NZD. Similarly, EUR/NZD is also highly negatively correlation with the S&P 500. As with EUR/AUD, the correlation coefficient is also -0.92. In addition, the price movement of the EUR/NZD has also formed a descending wedge, with a target of 1.8475 at the 100% retracement of the falling wedge. One of the few differences between the price action of EUR/AUD and EUR/NZD is that EUR/NZD fell less than EUR/AUD from the March 19th highs, and therefore, broke out of its descending wedge yesterday instead of today!
Source: Tradingview, City Index
Today, the S&P 500 closed -2.35%, EUR/AUD closed +1.33% and EUR/NZD closed +1.22%. If you are looking for a reason that stock indices have turned, you can always look at the EUR/AUD and EUR/NZD to see what they are doing.
After putting in a low on March 23rd, the S&P 500 has been moving aggressively higher, only pausing at the 38.2% Fibonacci retracement level from the February 20th highs to the March 23rd lows. It broke out of a pennant formation on the move higher which targeted near 2900/2925, near horizontal resistance and the 61.8% Fibonacci retracement level of the previously mentioned timeframe. Today, price halted at minor horizontal resistance and moved lower to test yesterday’s daily low and put in an ominous, dark candlestick.
Source: Tradingview, CME, FOREX.com
So, the question to ask now is: Why did stocks stop moving higher HERE? Was it the minor horizontal resistance? Was it the expectations of weaker data (the move started overnight)? Was it more bad coronavirus news? Sometimes we don’t know, and that’s ok. But we should always be looking for clues as to why, so that when we see it again, we may already have an answer!
Let’s look at EUR/AUD. The currency pair is highly negatively correlated with the S&P 500. That is, when the EUR/AUD moves in one direction, the S&P 500 moves in the opposite direction. The current correlation coefficient is -0.92. With this context in mind, the price movement of the pair has formed a descending wedge and has broken higher today. The target of a descending wedge is a 100% retracement of the wedge, which is near 1.8000. Therefore, because of strong correlation, if EUR/AUD is breaking higher, the S&P 500 should be moving lower.
Source: Tradingview, FOREX.com
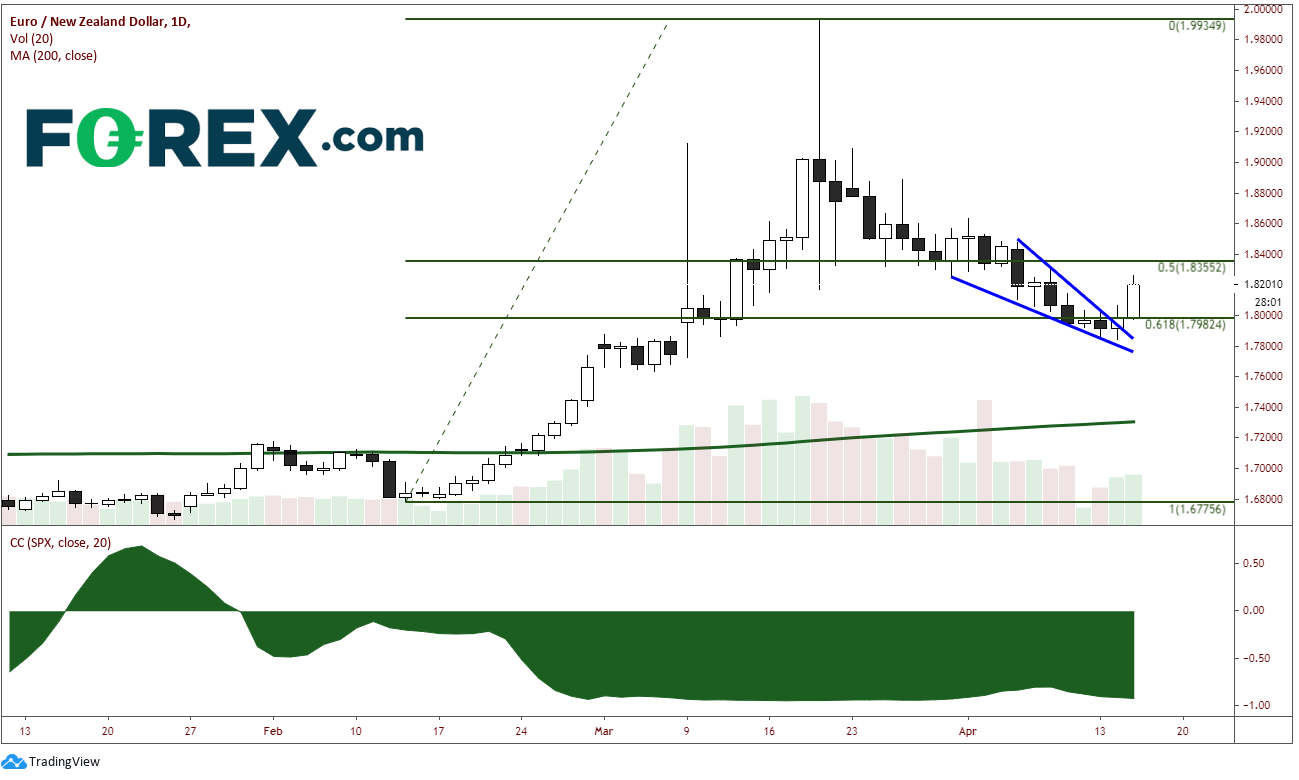
Now let’s similarly look at EUR/NZD. Similarly, EUR/NZD is also highly negatively correlation with the S&P 500. As with EUR/AUD, the correlation coefficient is also -0.92. In addition, the price movement of the EUR/NZD has also formed a descending wedge, with a target of 1.8475 at the 100% retracement of the falling wedge. One of the few differences between the price action of EUR/AUD and EUR/NZD is that EUR/NZD fell less than EUR/AUD from the March 19th highs, and therefore, broke out of its descending wedge yesterday instead of today!
Source: Tradingview, FOREX.com
Today, the S&P 500 closed -2.35%, EUR/AUD closed +1.33% and EUR/NZD closed +1.22%. If you are looking for a reason that stock indices have turned, you can always look at the EUR/AUD and EUR/NZD to see what they are doing.


Open an account in minutes
Experience award-winning platforms with fast and secure execution, and enjoy tight spreads from 0.5 pts on FX and 0.3 pts on indices.
Economic calendar
Web Trader platform
Our sophisticated web-based platform is packed with features.
Related articles
USD/CAD shooting star puts September surge on notice
USD/CAD has printed a clear bearish reversal pattern after an extraordinary September surge, but confirmation may depend heavily on how US Treasury yields react to Friday’s payrolls report.

USD/CHF Reverses as Swiss Franc Surges amid Bond Carnage
USD/CHF reverses from channel resistance as bond volatility surges and broad Swiss franc strength points to a possible carry-trade unwind.


USD/MXN Analysis: Is Super Peso Starting to Fade?
Over recent trading sessions, the Mexican peso has continued to show signs of weakness against the U.S. dollar. This can already be seen in USD/MXN, which has gained more than 1.7% over the last three sessions, highlighting sustained buying pressure in favor of the dollar in the short term.

This report is intended for general circulation only. It should not be construed as a recommendation, or an offer (or solicitation of an offer) to buy or sell any financial products. The information provided does not take into account your specific investment objectives, financial situation or particular needs. Before you act on any recommendation that may be contained in this report, independent advice ought to be sought from a financial adviser regarding the suitability of the investment product, taking into account your specific investment objectives, financial situation or particular needs.
StoneX Financial Pte. Ltd., may distribute reports produced by its respective foreign entities or affiliates within the StoneX group of companies or third parties pursuant to an arrangement under Regulation 32C of the Financial Advisers Regulations. Where the report is distributed to a person in Singapore who is not an accredited investor, expert investor or an institutional investor (as defined in the Securities Futures Act), StoneX Financial Pte. Ltd. accepts legal responsibility to such persons for the contents of the report only to the extent required by law. Singapore recipients should contact StoneX Financial Pte. Ltd. at 6826 9988 for matters arising from, or in connection with the report.
In the case of all other recipients of this report, to the extent permitted by applicable laws and regulations neither StoneX Financial Pte. Ltd. nor its associated companies will be responsible or liable for any loss or damage incurred arising out of, or in connection with, any use of the information contained in this report and all such liability is hereby expressly disclaimed. No representation or warranty is made, express or implied, that the content of this report is complete or accurate.
StoneX Financial Pte. Ltd. is not under any obligation to update this report.
Trading CFDs carries a high level of risk that may not be suitable for some investors. Consider your investment objectives, level of experience, financial resources, risk appetite and other relevant circumstances carefully. The possibility exists that you could lose some or all of your investments, including your initial deposits. If in doubt, please seek independent expert advice. Visit www.forex.com/en-sg/terms-and-policies for the complete Risk Disclosure Statement.