



Nasdaq 100 Analysis: NDX Continues to Struggle for Direction Near Record Highs
Over recent trading sessions, the Nasdaq 100 has continued to display an increasingly evident lack of direction in the short term. This can be seen in recent price action, as the index has recorded a move of just over 1.00% on average over the last four trading sessions, highlighting a period of neutrality that continues to limit a clearer directional move.
Share this:

Over recent trading sessions, the Nasdaq 100 has continued to display an increasingly evident lack of direction in the short term. This can be seen in recent price action, as the index has recorded a move of just over 1.00% on average over the last four trading sessions, highlighting a period of neutrality that continues to limit a clearer directional move. For now, this lack of momentum remains part of the market even after events such as Jackson Hole, which have failed to consistently strengthen demand across the technology sector. As a result, mixed price action remains a key theme and could continue to be relevant over the coming trading sessions.

Factors That Could Continue Limiting Demand Activity
The first element worth considering is that the Jackson Hole event once again put the possibility of a September rate hike on the table. Comments from Kevin Warsh highlighted that inflation remains a relevant concern as long as it stays above the 2.00% target area. In addition, CME Group probabilities are now showing more than a 60% chance of a rate increase at the Federal Reserve's mid-September meeting.
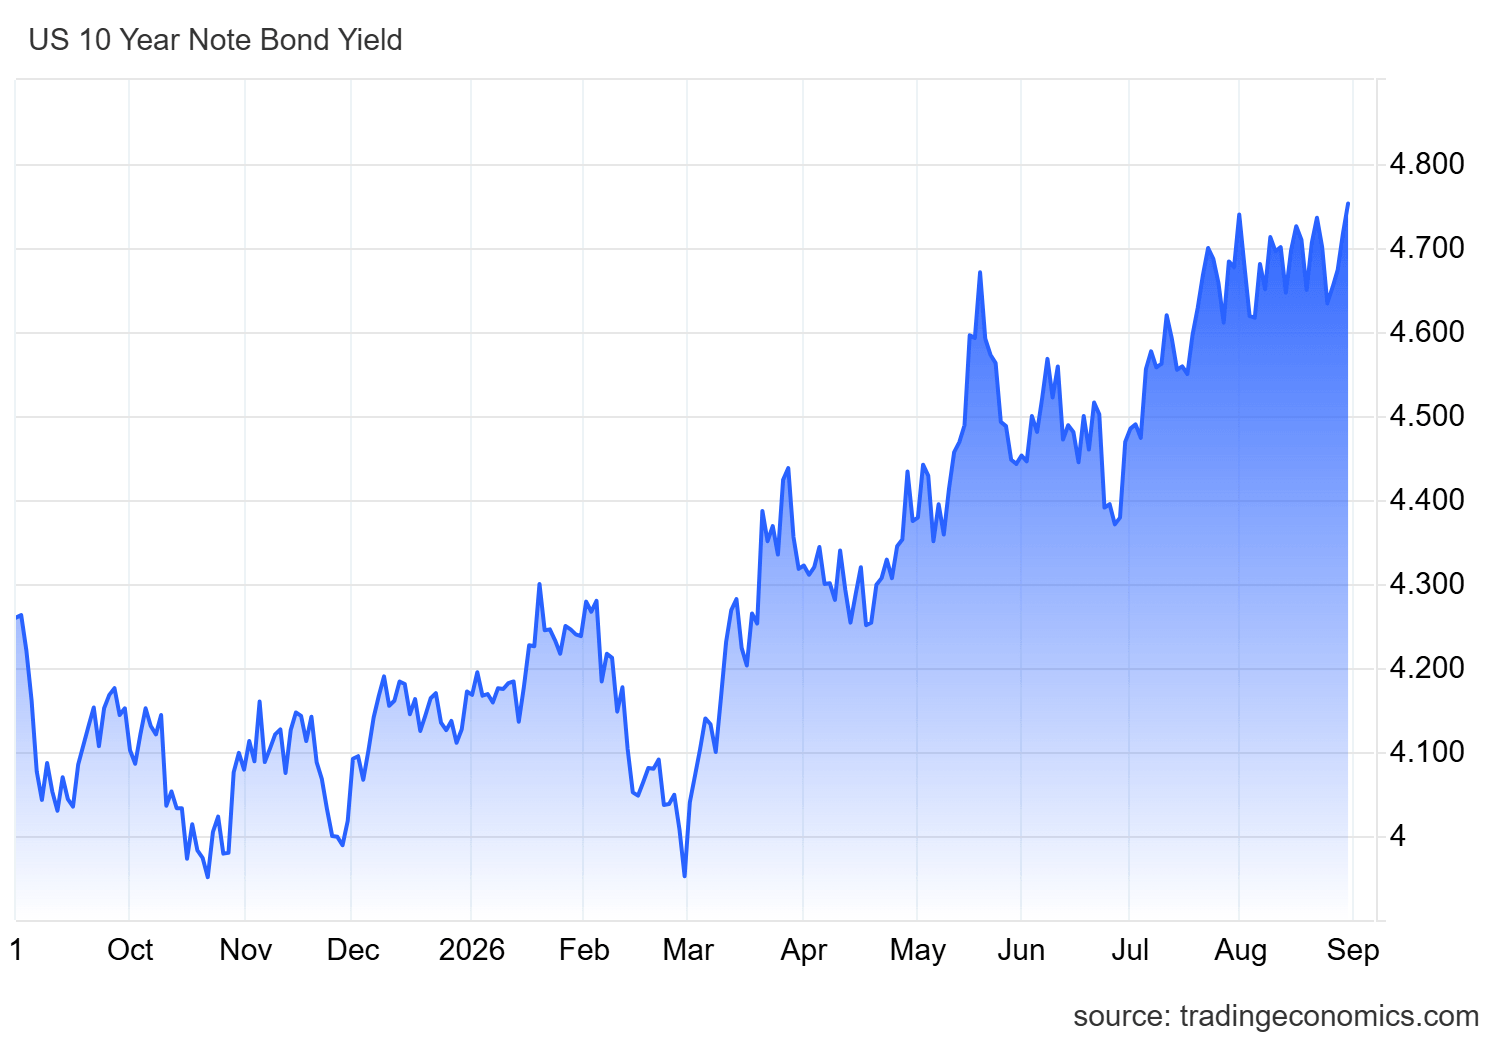
This situation is particularly important for one of Nasdaq's main competing markets: U.S. Treasuries. Following Jackson Hole, 10-year Treasury yields climbed to new highs for 2026 above the 4.75% area. This development increases the relative attractiveness of fixed-income assets and may be limiting part of the capital available for risk-oriented markets such as Nasdaq.
Source: TradingEconomics
Another factor that continues to influence the index is the significant level of investment in artificial intelligence across the technology sector. Current estimates suggest that AI-related CapEx could exceed $700 billion in 2026 alone. The debate is no longer centered on whether companies can continue spending, but rather on when this investment will begin translating more clearly into margins and earnings capable of justifying it.
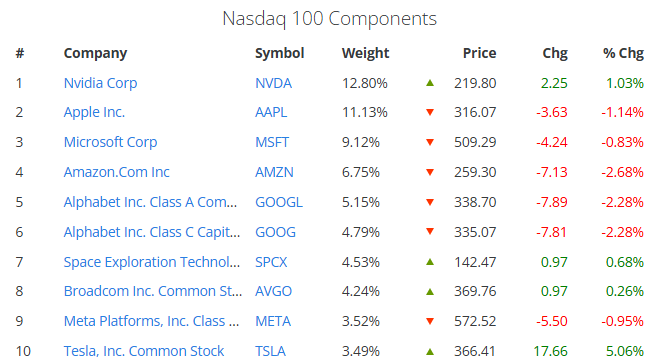
This dynamic was partially reflected in the case of Nvidia, whose stock continues to trade around the $220 area despite reporting results above expectations. The market appears to be entering a stage where simply beating forecasts is no longer enough to trigger a dominant buying response. Instead, investors increasingly want evidence that future growth can significantly exceed already elevated expectations.
Taking all of this into account, the market is facing a combination of factors that could continue limiting demand around Nasdaq. On one hand, the possibility of a more aggressive Federal Reserve continues to support the appeal of alternative assets such as bonds. On the other, uncertainty remains regarding how quickly massive AI investments will translate into meaningful profitability.
This can also be seen among the index's largest components, where mixed performance continues to dominate. While Tesla has gained nearly 5.00%, companies such as Amazon and Alphabet have declined by more than 2.00%. This divergence continues to reflect a lack of alignment in demand that has become even more noticeable following the comments delivered at Jackson Hole.
Source: slickcharts
As a result, the slowdown in buying momentum observed over recent weeks may be becoming more evident now that most major companies have already reported earnings and market attention has shifted back toward monetary policy. As long as these concerns remain in place, a period of indecision could continue to be an important feature of Nasdaq price action in the sessions ahead.
Long-Term Confidence Continues to Show Caution
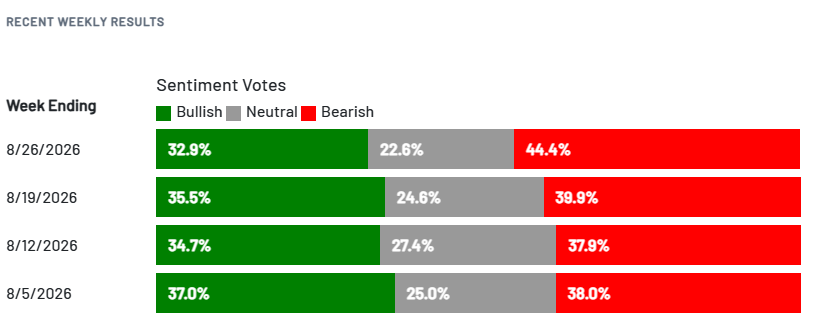
The medium- and long-term outlook continues to reflect signs of uncertainty. This can be observed through the AAII sentiment survey, where expectations for the stock market over the next six months show 32.9% bullish sentiment, 22.6% neutrality, and 44.4% bearish sentiment. These readings indicate that a significant portion of market participants still have reservations about the market's ability to sustain consistent growth over the coming months and continue to lean toward more cautious scenarios.
Part of those concerns remains linked to the possibility that interest rates could stay elevated for longer and that meaningful easing of restrictions on consumption and liquidity within the U.S. economy may not materialize soon. This continues to point to an environment that is not yet entirely favorable for a stronger expansion of the technology sector.
Source: AAII
Unless confidence indicators begin to show a clearer direction, uncertainty is likely to remain an important factor for Nasdaq. The absence of a dominant conviction between bullish and bearish views could continue supporting consolidation and price action without a clearly defined trend during the weeks ahead.
Nasdaq 100 Technical Outlook
Source: StoneX, Tradingview
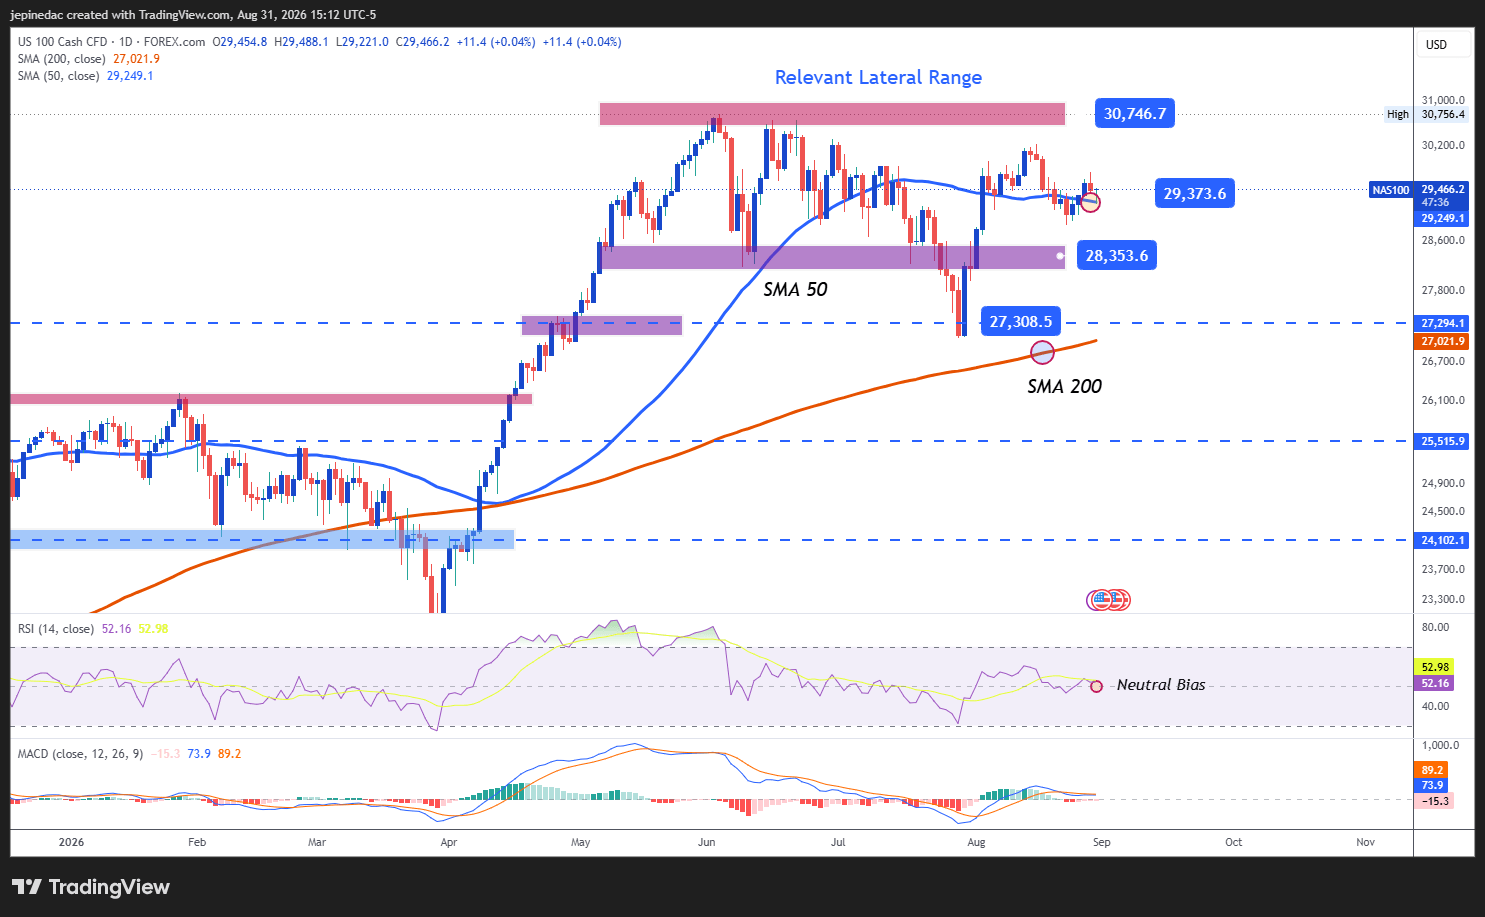
- Indecision Remains a Constant: For several weeks, Nasdaq has continued to respect a trading range between resistance at 30,700 points and support at 28,300 points. Recent price movements remain insufficient to break either boundary, making this structure the most important technical pattern currently visible on the chart.
- RSI: The RSI continues to fluctuate around the neutral 50 level, a sign that the balance between buyers and sellers remains relatively stable. As long as the indicator stays near this area, the lack of direction could continue to dominate short-term price action.
- MACD: A similar reading can be observed in the MACD, whose histogram remains close to the neutral 0 line. This suggests that the average strength of short-term moving averages remains balanced and reinforces the importance of the current consolidation phase.
Key Levels to Watch:
- 30,700 Points – Key Resistance: This level represents the most important upside barrier on the chart and coincides with the highs recorded during 2026. A move back toward this area could challenge the current sideways structure and open the door to a more dominant bullish bias over the coming weeks.
- 29,300 Points – Nearby Barrier: This level coincides with the 50-period Simple Moving Average. As long as price continues to develop around this area, the neutrality observed in recent weeks may remain in place, allowing the current trading range to continue acting as the dominant structure.
- 28,300 Points – Key Support: An important support zone that coincides with a major consolidation phase observed in April of this year. If selling pressure extends toward this level, a stronger bearish bias could begin to emerge and potentially open the door to a short-term downtrend.
Written by Julian Pineda, CFA, CMT – Market Analyst
Follow him on: @julianpineda25
Related tags:
Latest market news




Open an account in minutes
Experience award-winning platforms with fast and secure execution, and enjoy tight spreads from 0.5 pts on FX and 0.3 pts on indices.
Economic calendar
Web Trader platform
Our sophisticated web-based platform is packed with features.
Related articles

Indices weekly outlook: Can the DAX rebound turn into a reversal?
Global indices managed to bounce back towards the end of the week as risk mood improved following Thursday’s drop in bond yields and a slight decline in oil prices. But by late Friday afternoon, oil prices had made back most of Thursday’s drop and the bond markets remained under some pressure as European bourses closed for trading.


DAX, Gold and Bitcoin forecast: Dollar falls, yields retreat as risk appetite returns
Markets went from risk off to risk on yesterday afternoon and we have since kicked on with some follow-up buying of stocks, gold and silver, while the dollar has also shown signs of weakness. Risk appetite turned positive after bond yields and oil prices both retreated yesterday.

Hang Seng Tech: Improving earnings can't stop the technical breakdown
Hang Seng Tech continues to slide despite improving earnings expectations across many major constituents. With valuations contracting and key technical support broken, the question is whether the selling has further to run.

This report is intended for general circulation only. It should not be construed as a recommendation, or an offer (or solicitation of an offer) to buy or sell any financial products. The information provided does not take into account your specific investment objectives, financial situation or particular needs. Before you act on any recommendation that may be contained in this report, independent advice ought to be sought from a financial adviser regarding the suitability of the investment product, taking into account your specific investment objectives, financial situation or particular needs.
StoneX Financial Pte. Ltd., may distribute reports produced by its respective foreign entities or affiliates within the StoneX group of companies or third parties pursuant to an arrangement under Regulation 32C of the Financial Advisers Regulations. Where the report is distributed to a person in Singapore who is not an accredited investor, expert investor or an institutional investor (as defined in the Securities Futures Act), StoneX Financial Pte. Ltd. accepts legal responsibility to such persons for the contents of the report only to the extent required by law. Singapore recipients should contact StoneX Financial Pte. Ltd. at 6826 9988 for matters arising from, or in connection with the report.
In the case of all other recipients of this report, to the extent permitted by applicable laws and regulations neither StoneX Financial Pte. Ltd. nor its associated companies will be responsible or liable for any loss or damage incurred arising out of, or in connection with, any use of the information contained in this report and all such liability is hereby expressly disclaimed. No representation or warranty is made, express or implied, that the content of this report is complete or accurate.
StoneX Financial Pte. Ltd. is not under any obligation to update this report.
Trading CFDs carries a high level of risk that may not be suitable for some investors. Consider your investment objectives, level of experience, financial resources, risk appetite and other relevant circumstances carefully. The possibility exists that you could lose some or all of your investments, including your initial deposits. If in doubt, please seek independent expert advice. Visit www.forex.com/en-sg/terms-and-policies for the complete Risk Disclosure Statement.