


Nasdaq 100 awaits the Magnificent Seven
The Nasdaq 100 is searching for its next catalyst. With Magnificent Seven earnings about to begin, attention now turns to whether results and guidance can justify the rally.
Share this:

- Key Magnificent Seven earnings dates to watch
- AI leadership faces its biggest earnings test
- History favours gains, but volatility remains
- Triangle pattern points to looming breakout
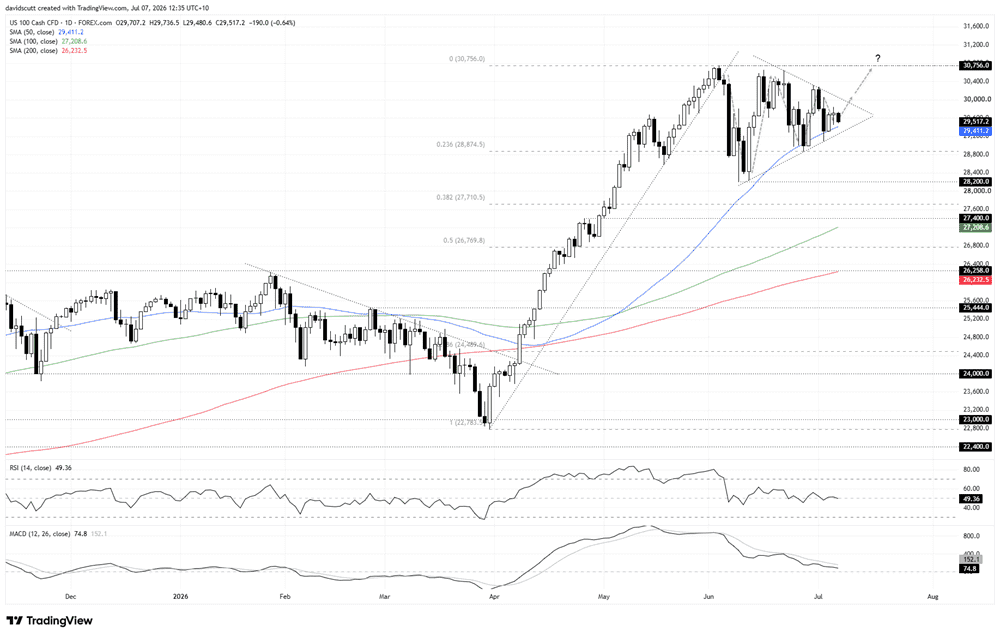
The Nasdaq 100 staged a breakneck rally from the lows struck in late March, leaving it sitting just beneath record highs. Since then, the price action has consolidated into what looks to be a symmetrical triangle. The question now is whether earnings season will provide the catalyst for a definitive breakout, and if so, in which direction.
With many of the index's largest constituents due to report over the coming weeks, investors will be watching not only the results themselves but, more importantly, whether guidance justifies the optimism priced into markets.
The countdown is on
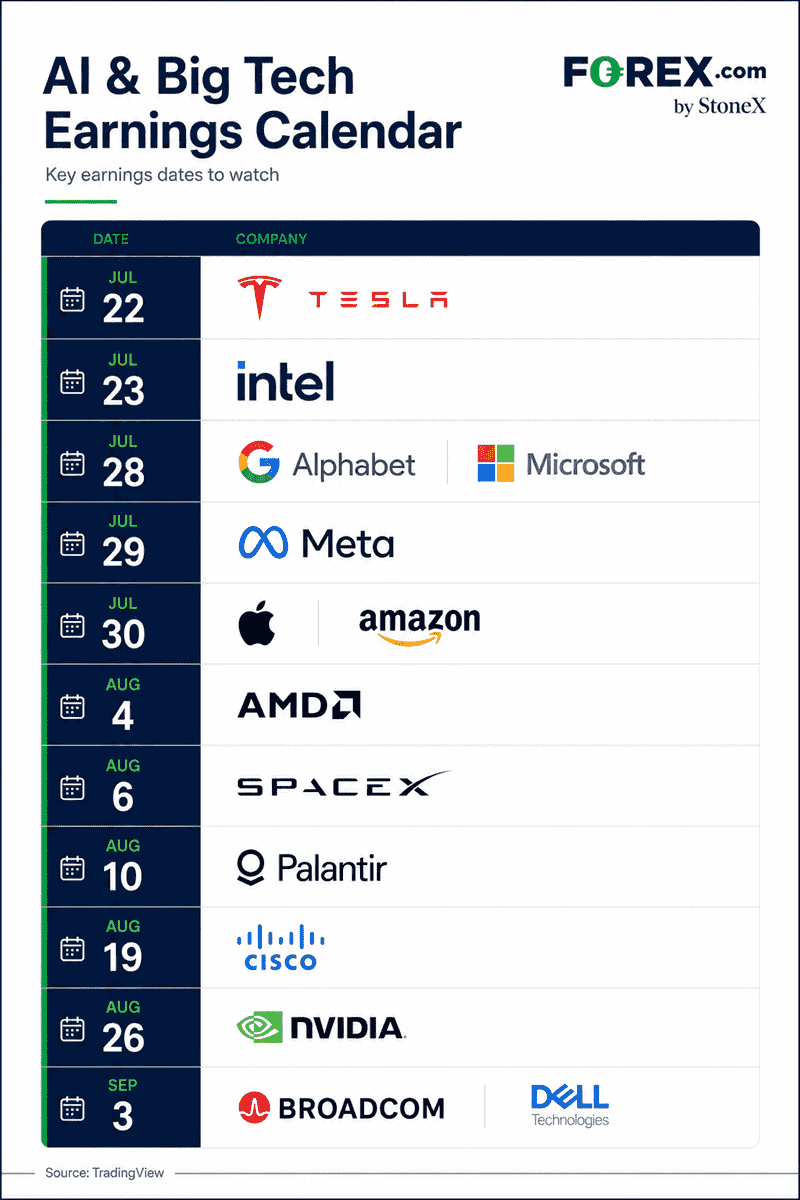
Reporting season for the Magnificent Seven gets underway with Tesla on July 22, before attention quickly shifts to the companies at the heart of the AI investment buildout. Alphabet and Microsoft report on July 28, followed by Meta a day later and Apple and Amazon on July 30. Semiconductor heavyweights AMD, Nvidia, Broadcom and Dell then round out the reporting season through early September.
Source: FOREX.com
AI leadership under the microscope
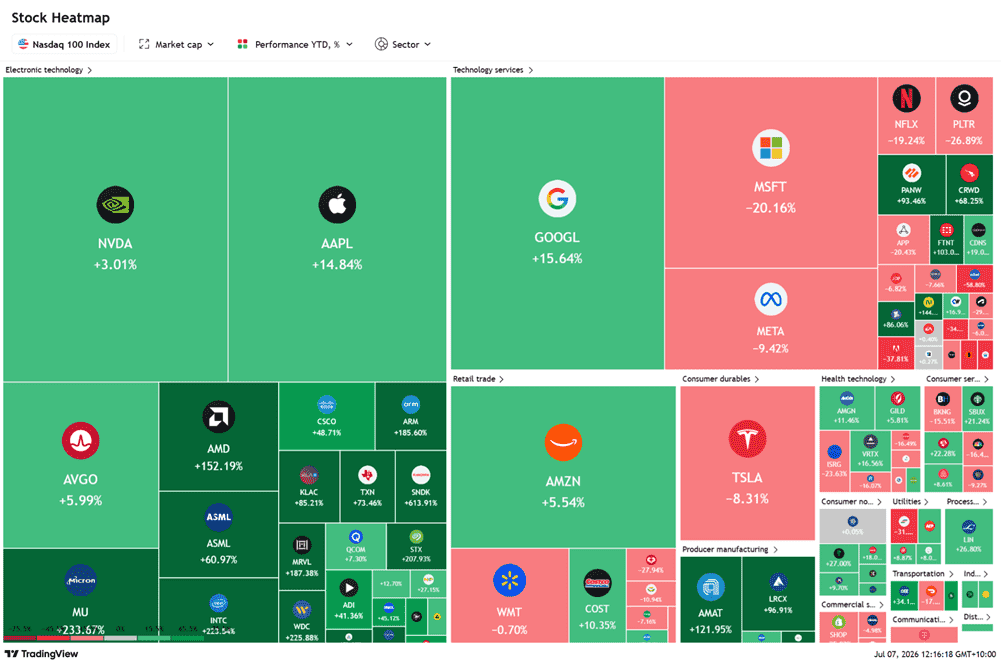
A glance at year-to-date performance of individual constituents highlights an interesting divergence. Companies supplying the AI ecosystem have comfortably outperformed the hyperscalers, reflecting rampant demand for chips, networking and data centre infrastructure. However, despite lagging, it will still be the Magnificent Seven that dictate directional risk for the Nasdaq 100. Their sheer size means their earnings and, more importantly, their guidance will carry far greater weight at the index level than almost any other group of companies.
Source: TradingView
The divergence also highlights one of the biggest questions surrounding earnings season. AI infrastructure suppliers may have outperformed, but as investment continues to accelerate, are they laying the foundations for future oversupply and margin pressure? If so, traders should be alert to the risk that hyperscalers may be preparing to moderate the pace of AI-related capital expenditure. That would mark a meaningful shift for a market that has been built on ever-increasing AI investment.
The odds favour the bulls
History suggests the period from mid-July through to the end of August has generally been bullish. Over the past decade, the index has posted an average gain of 2.49% during the period, with a median return of 2.48%. It finished higher in seven of the past 10 years.
However, context is important. The sample spans vastly different market regimes, including the pandemic, the subsequent surge in inflation and one of the most aggressive Federal Reserve tightening cycles in decades. Of note, two of the three negative years came when the Fed was either tightening policy or maintaining a restrictive stance. While the funds rate is lower today, the broader policy backdrop isn't entirely dissimilar. The Fed has dropped its easing bias, inflation remains above target and traders are pricing more than one full rate hike by the middle of next year. And that's before considering how hard the index has run into earnings.
It should also be remembered that earnings season is as much about expectations as it is results. While most companies exceed analyst forecasts, the bar for investors is often set far higher. When earnings fail to impress, the subsequent reaction can be carnage, helping explain the average maximum drawdown of 3.40% during the period. But when companies continue to clear the bar without any major negative earnings surprises, the index has also proved capable of delivering powerful gains, reflected in the average maximum rally of just over 5%.
Coiled beneath the highs
Source: TradingView
From a technical perspective, the price has spent the past month consolidating within what resembles a symmetrical triangle, leaving the price coiled just beneath record highs.
Momentum has shifted back to neutral, with RSI (14) drifting towards 50 while MACD sits beneath its signal line, albeit still in positive territory.
While symmetrical triangles imply two-way directional risk, the preceding trend provides important context. It follows a powerful rally that lifted the pric above its key medium and long-term moving averages, all of which continue to slope higher. More recently, every test of the rising 50-day moving average has been bought.
I suspect this is a consolidation of the earlier bull move that will ultimately give way to an upside breakout. If so, a sustained break above triangle resistance may pave the way for a retest of the record high at 30,756, and potentially fresh highs beyond.
For now, patience is warranted. I'd rather see price confirm that view with a sustained break of triangle resistance than try to anticipate the move beforehand.
Should my bias prove incorrect, the 23.6% Fibonacci retracement of the March-June bull move looms as the first downside level of note. Below that, the lower boundary of the triangle near 28,200 is the next area to watch.
Latest market news




Open an account in minutes
Experience award-winning platforms with fast and secure execution, and enjoy tight spreads from 0.5 pts on FX and 0.3 pts on indices.
Economic calendar
Web Trader platform
Our sophisticated web-based platform is packed with features.
Related articles
RBA delivers 25bp hike, Bullock now the main event
The RBA delivered the expected 25bp hike, but Bullock’s press conference now looms as the bigger volatility risk for AUD/USD and the ASX 200.
Gold outlook: XAU/USD hammered, stretched and vulnerable to a sharp rebound
Gold is getting hammered for solid fundamental reasons, but history suggests extreme four-hourly oversold conditions can produce violent countertrend rallies.
EUR/USD, USD/JPY Outlook: Oil, yields and an FX identity crisis
Crude oil is setting the tone across rates and FX, leaving EUR/USD vulnerable and USD/JPY caught between higher Treasury yields and the growing threat of intervention
This report is intended for general circulation only. It should not be construed as a recommendation, or an offer (or solicitation of an offer) to buy or sell any financial products. The information provided does not take into account your specific investment objectives, financial situation or particular needs. Before you act on any recommendation that may be contained in this report, independent advice ought to be sought from a financial adviser regarding the suitability of the investment product, taking into account your specific investment objectives, financial situation or particular needs.
StoneX Financial Pte. Ltd., may distribute reports produced by its respective foreign entities or affiliates within the StoneX group of companies or third parties pursuant to an arrangement under Regulation 32C of the Financial Advisers Regulations. Where the report is distributed to a person in Singapore who is not an accredited investor, expert investor or an institutional investor (as defined in the Securities Futures Act), StoneX Financial Pte. Ltd. accepts legal responsibility to such persons for the contents of the report only to the extent required by law. Singapore recipients should contact StoneX Financial Pte. Ltd. at 6826 9988 for matters arising from, or in connection with the report.
In the case of all other recipients of this report, to the extent permitted by applicable laws and regulations neither StoneX Financial Pte. Ltd. nor its associated companies will be responsible or liable for any loss or damage incurred arising out of, or in connection with, any use of the information contained in this report and all such liability is hereby expressly disclaimed. No representation or warranty is made, express or implied, that the content of this report is complete or accurate.
StoneX Financial Pte. Ltd. is not under any obligation to update this report.
Trading CFDs carries a high level of risk that may not be suitable for some investors. Consider your investment objectives, level of experience, financial resources, risk appetite and other relevant circumstances carefully. The possibility exists that you could lose some or all of your investments, including your initial deposits. If in doubt, please seek independent expert advice. Visit www.forex.com/en-sg/terms-and-policies for the complete Risk Disclosure Statement.