



Nasdaq 100 Forecast: The index pulls back from all-time highs ahead of the FOMC
The start of the week has been challenging for Nasdaq 100 price action in the short term, mainly due to a mild pullback from all-time highs. Over the past two trading sessions, the index has posted a decline of around 1.00%, reflecting a loss of bullish momentum.
Share this:

The start of the week has been challenging for Nasdaq 100 price action in the short term, mainly due to a mild pullback from all-time highs. Over the past two trading sessions, the index has posted a decline of around 1.00%, reflecting a loss of bullish momentum.
For now, this selling pressure appears to be driven by market expectations ahead of the Federal Reserve’s upcoming decision, as well as the start of earnings season for major technology companies. Both factors could shift market sentiment and lead to a more pronounced phase of indecision in the short term.


What to expect from the central bank?
On April 29, the Federal Reserve will announce its interest rate decision. According to CME Group data, there is a near 100% probability that the central bank will keep rates unchanged within the 3.50% - 3.75% range, meaning no major surprises are expected from the decision itself.
However, market focus will be on the post-decision commentary, which could confirm expectations of prolonged rate stability throughout 2026.
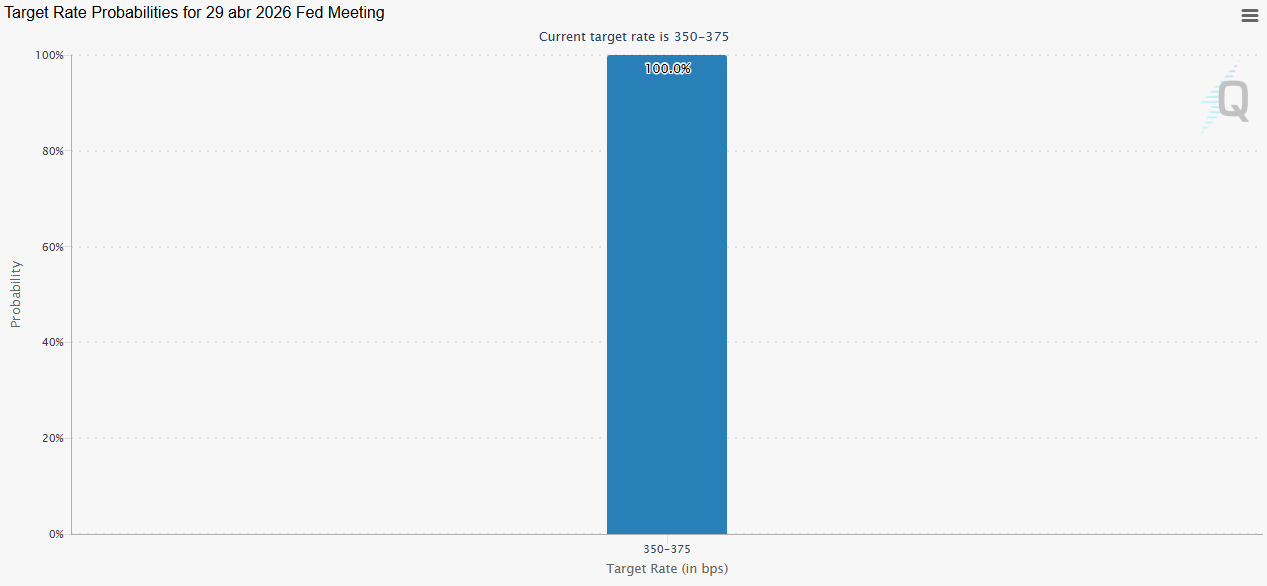
Source: CMEGROUP
This environment is already being reflected in the US Treasury market, which is often seen as a substitute for equity indices. In particular, the 10-year yield has resumed an upward trend, moving back above the 4.3% level, indicating that the market is already pricing in stable rates.
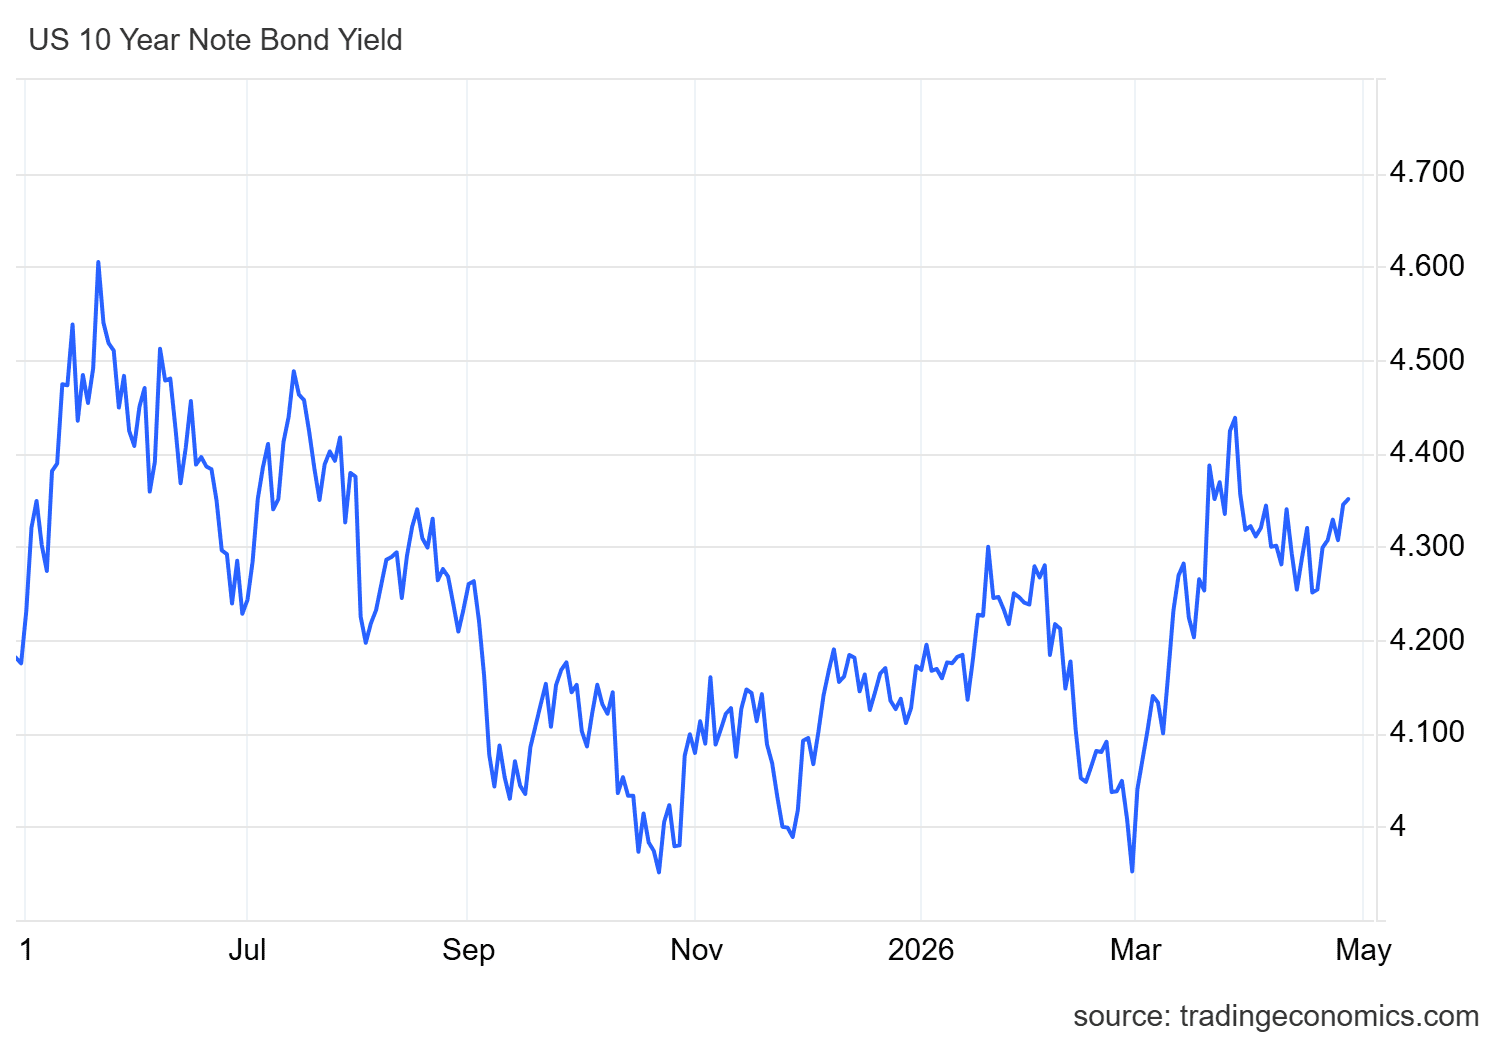
Source: TradingEconomics
This dynamic is important because higher bond yields tend to reduce the attractiveness of risk assets such as equities. Bonds offer relatively stable returns, while stocks depend on economic growth and earnings expectations.
Additionally, a higher-for-longer rate environment can weigh on consumption and financing conditions, which may eventually impact the growth outlook for technology companies.
In this context, part of the Nasdaq’s current neutrality may be tied to monetary policy expectations. If the market continues to price in stable rates for longer, and bond yields keep rising, this could continue to limit buying strength in the index in the coming sessions.
What to expect from earnings?
This week is also key due to earnings releases from four of the largest companies within the Nasdaq 100, which could be decisive for short-term market confidence.
Microsoft, Amazon, and Alphabet will report on April 29 after market close, while Apple will release results on April 30. Expectations are as follows:
- Microsoft: EPS of $4.07 vs $3.46 in the same period last year.
- Amazon: EPS of $1.60 vs $1.59 in the same period last year.
- Alphabet: EPS of $2.64 vs $2.81 in the same period last year.
- Apple: EPS of $1.92 vs $1.65 in the same period last year.
The key takeaway is that, in most cases, the market expects solid earnings growth compared to the previous year, keeping optimism alive within the tech sector.
However, market reaction will depend not only on whether expectations are met, but on whether companies are able to exceed them. Strong results could reignite buying confidence and support further upside in Nasdaq. On the other hand, mixed or disappointing results could reinforce the current indecision or even trigger a deeper short-term correction.
Technical outlook for the Nasdaq 100
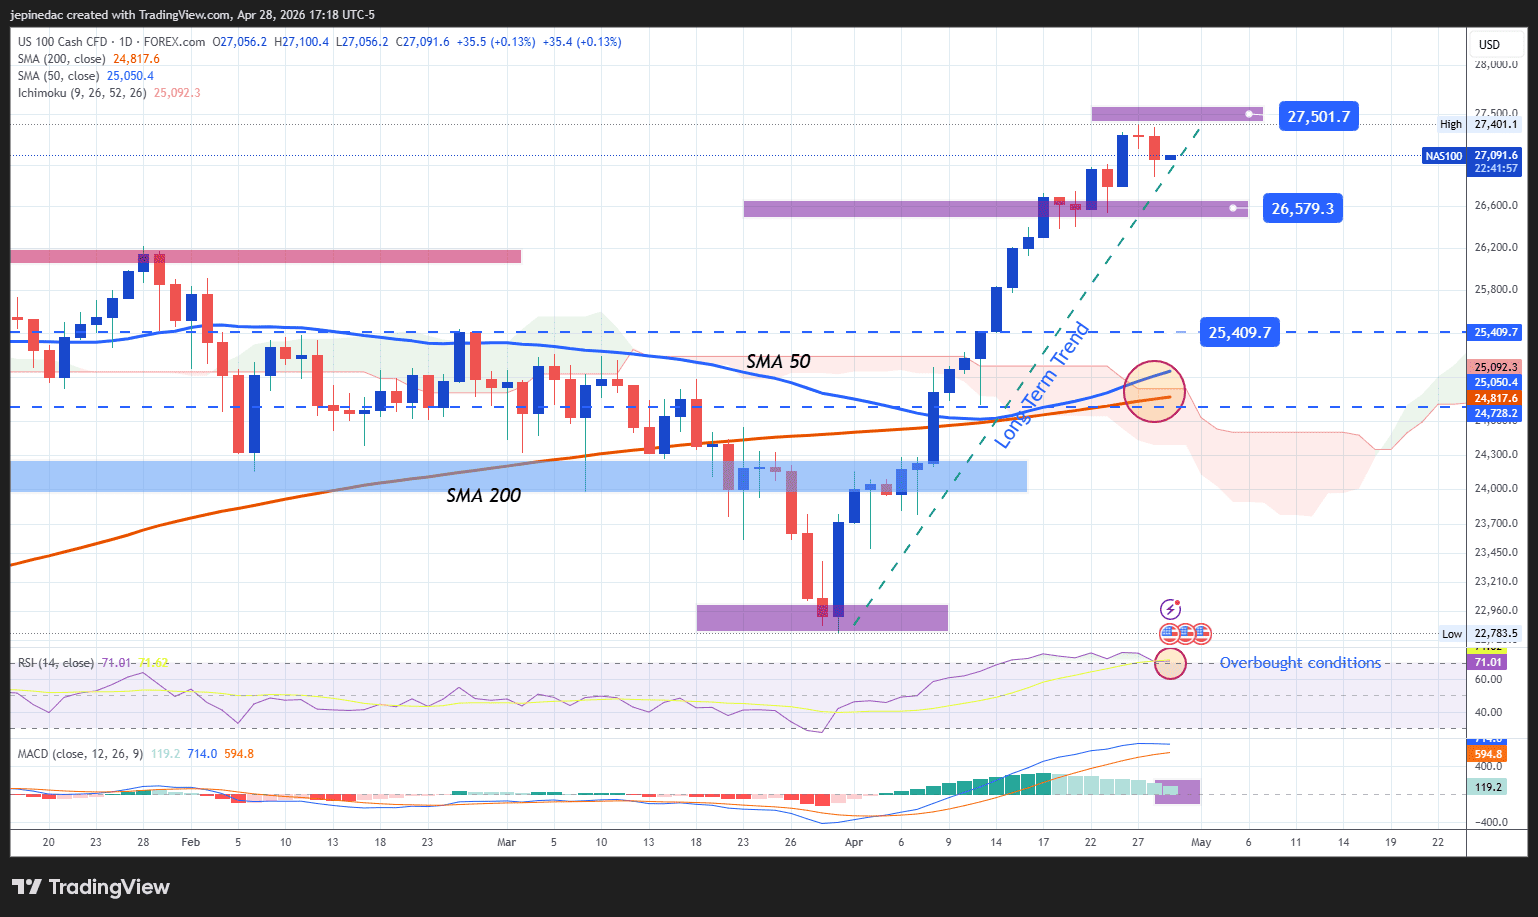
Source: StoneX, Tradingview
- Short-term trendline under pressure: The recovery seen in recent weeks allowed for the formation of a short-term upward trendline. However, recent pullbacks from all-time highs have started to question the strength of this structure. If buying pressure fails to regain control, a break below this trendline could lead to a broader correction phase or a more defined sideways environment in the short term.
- MACD: The MACD histogram is once again approaching the zero line, reflecting a loss of bullish momentum. This suggests that the recent rally is beginning to fade and that indecision may become more dominant in the coming sessions.
- RSI: The RSI is flattening near overbought levels (around 70), indicating that bullish momentum has been strong, but also highlighting an increasing risk of correction due to overstretched price action.
Key levels:
- 27,500 points – Key resistance: With no historical references above current levels, this stands as the main psychological barrier. A sustained break above this level could reactivate the dominant bullish bias and support further upside.
- 26,579 points – Near-term barrier: A level of recent lows acting as immediate support. Price action around this zone could determine whether the current correction remains limited or deepens further.
- 25,400 points – Key support: A zone of previous weekly lows. A move toward this level could invalidate the recent bullish structure and open the door to a more structured correction phase or a more prolonged period of indecision in the coming weeks.
Written by Julian Pineda, CFA, CMT – Market Analyst
Follow him on: @julianpineda25
Latest market news




Open an account in minutes
Experience award-winning platforms with fast and secure execution, and enjoy tight spreads from 0.5 pts on FX and 0.3 pts on indices.
Economic calendar
Web Trader platform
Our sophisticated web-based platform is packed with features.
Related articles
S&P 500, Nasdaq, Dow and Russell 2000 For the Week Ahead
Stocks started to shake last week and there was even a hint of this in the prior week. The question now is whether we’re at the point where buyers may abandon pullbacks as get closer to mid-term elections.

Magnificent Seven Earnings Preview: Is the AI Boom Facing Its Biggest Test Yet?
After a wobble in the broader AI trade, the Magnificent Seven" stocks are reporting earnings in the coming week - see the key themes and Nasdaq 100 levels to watch!


Nasdaq 100 forecast: Tech stocks not out of woods yet
US index futures pushed higher in the first half of Friday’s session, taking cues from a strong performance from European equities. Both European and US equity futures extending yesterday’s impressive recovery after the sharp sell-off earlier in the week. But the lingering concerns around the AI investment cycle remain, while bond markets were easing lower again, lifting yields.

This report is intended for general circulation only. It should not be construed as a recommendation, or an offer (or solicitation of an offer) to buy or sell any financial products. The information provided does not take into account your specific investment objectives, financial situation or particular needs. Before you act on any recommendation that may be contained in this report, independent advice ought to be sought from a financial adviser regarding the suitability of the investment product, taking into account your specific investment objectives, financial situation or particular needs.
StoneX Financial Pte. Ltd., may distribute reports produced by its respective foreign entities or affiliates within the StoneX group of companies or third parties pursuant to an arrangement under Regulation 32C of the Financial Advisers Regulations. Where the report is distributed to a person in Singapore who is not an accredited investor, expert investor or an institutional investor (as defined in the Securities Futures Act), StoneX Financial Pte. Ltd. accepts legal responsibility to such persons for the contents of the report only to the extent required by law. Singapore recipients should contact StoneX Financial Pte. Ltd. at 6826 9988 for matters arising from, or in connection with the report.
In the case of all other recipients of this report, to the extent permitted by applicable laws and regulations neither StoneX Financial Pte. Ltd. nor its associated companies will be responsible or liable for any loss or damage incurred arising out of, or in connection with, any use of the information contained in this report and all such liability is hereby expressly disclaimed. No representation or warranty is made, express or implied, that the content of this report is complete or accurate.
StoneX Financial Pte. Ltd. is not under any obligation to update this report.
Trading CFDs carries a high level of risk that may not be suitable for some investors. Consider your investment objectives, level of experience, financial resources, risk appetite and other relevant circumstances carefully. The possibility exists that you could lose some or all of your investments, including your initial deposits. If in doubt, please seek independent expert advice. Visit www.forex.com/en-sg/terms-and-policies for the complete Risk Disclosure Statement.