



Nasdaq breakout builds as crude falls and chip stocks surge
Lower oil prices, semiconductor strength and improving technical momentum are helping Nasdaq futures overcome a hostile backdrop of higher Treasury yields and a stronger US dollar.
Share this:

- Nasdaq futures push to fresh multi-week highs
- Treasury yields have risen sharply, led by the front end
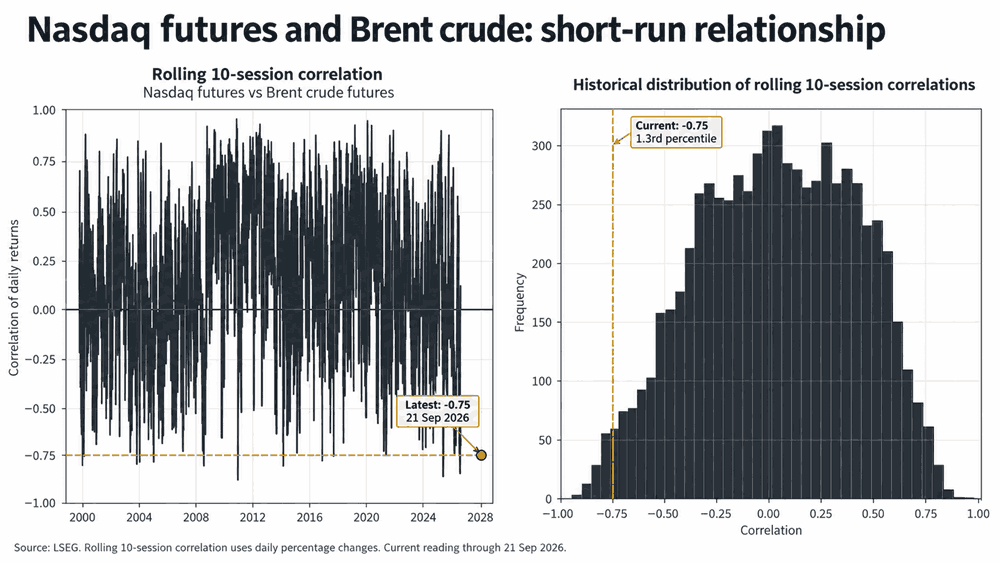
- Brent correlation with Nasdaq falls to around -0.75
- Semiconductor outperformance versus industrials reaches historical extremes
A combination of improving technicals, falling crude oil prices and a rotation away from cyclical sectors toward more structural earnings plays has helped the Nasdaq push to fresh multi-week highs, overcoming what would otherwise be a hostile backdrop for long-duration stocks following a large increase in Treasury yields and renewed strength in the US dollar.
Higher yields fail to derail Nasdaq rally
Often when you see US Treasury yields backing up and the US dollar rebounding, strength in the Nasdaq is not something many would anticipate. But that has not been the case over the past fortnight.
The US 2-year yield has risen around 38 basis points, an historically rare move, particularly by the standards of recent decades. The US dollar index has also gained just over 1%.
Despite that, Nasdaq futures are up around 1.8% over the same period, with the move gathering pace late last week following the Fed’s first interest rate hike in more than three years.
Crude emerges as latest macro focal point
Some may point to ongoing strength in earnings as justification to buy the dip. In this instance, I suspect macro forces may be playing a bigger role.
While crude prices are not something that immediately come to mind when assessing Nasdaq trades, anyone watching markets over recent weeks will have noticed how closely oil has been tied to many of the major macro drivers, whether interest rates or currency moves. Nasdaq may be no exception.
Source: LSEG
Over the past 10 sessions, the rolling correlation between daily moves in Nasdaq futures and Brent has fallen to around -0.75, placing it near the extreme lower tail of the historical distribution going back to 1999. That stands out because the relationship is usually weak, with the correlation between daily moves averaging only around +0.12 over the full sample.
That doesn’t mean crude has suddenly become the go-to swing factor when making trading decisions involving tech stocks. But it does suggest that, like so many other markets right now, attention has shifted heavily toward what is happening in crude.
This content was created by an affiliate of FOREX.com and represents the views and opinions of the author/speakers, not the views and opinions of FOREX.com, StoneX Group Inc., or its subsidiaries. The content has not been independently reviewed by FOREX.com.
Higher rates may be helping tech indirectly
While higher interest rates, driven in part by elevated crude prices and reinforced by the hawkish hike delivered by the Federal Reserve last Wednesday, would normally be expected to weigh directly on the Nasdaq, they may also be having an indirect positive effect by increasing the relative appeal of AI-linked earnings over more cyclically sensitive parts of the market.
A clear divergence has developed between tech stocks and more cyclical parts of the market. Since September 14, the Philadelphia Semiconductor Index (SOX) has gained around 7%, while the US industrials ETF XLI has been broadly flat, leaving semiconductor outperformance around the 97th percentile historically over that four-session window.
It doesn’t definitively prove investors are rotating out of cyclicals and into AI-linked stocks, given the short window. But it is consistent with the macro view that higher borrowing costs are creating greater headwinds for sectors whose earnings are more closely tied to the economic cycle.
Nasdaq eyes 30,000 as upside momentum builds
Source: TradingView
In what has been a difficult environment, with doubts about the AI demand outlook combining with a significant increase in energy prices, higher Treasury yields and a stronger US dollar, Nasdaq bears have had plenty to work with over the past month or so. Yet despite that, they’ve struggled to capitalise.
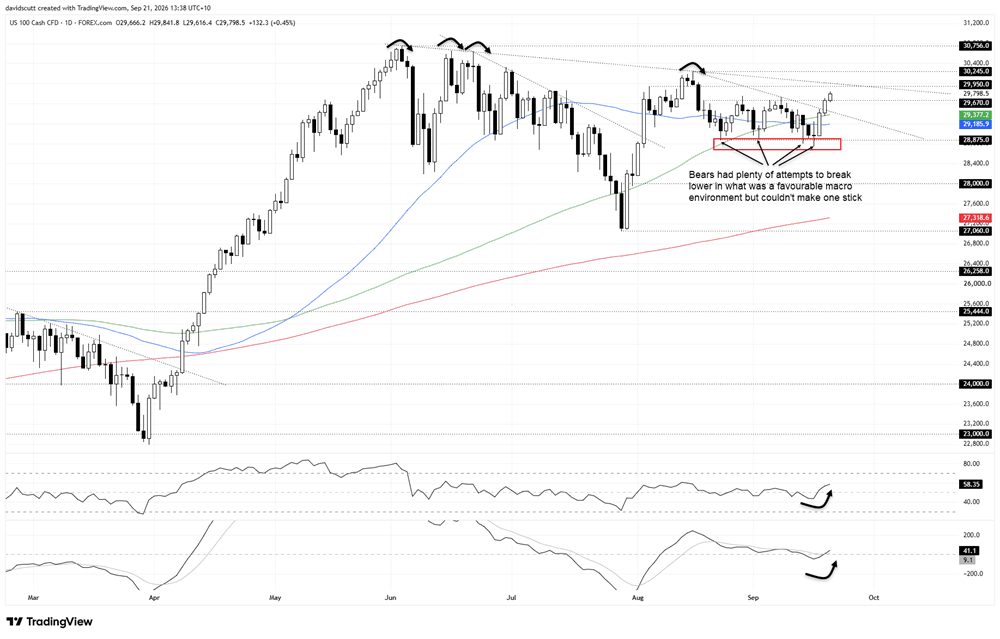
Technically, the price had been coiling in what was effectively a descending triangle, albeit with a fairly shallow slope. Support beneath 28,875 was tested multiple times, with the latest attempt last week briefly taking out the low set a couple of days earlier before bouncing sharply.
That rebound gathered pace on Thursday following the Fed, with the price breaking the minor downtrend running from the August highs before stalling around 29,670. The move has extended further during Asian trade today, albeit on extremely thin volumes with Japanese markets closed, helped by gains in South Korea’s KOSPI.
That has bulls eyeing a potential retest of the broader downtrend running from the highs set in early June. It comes in around 30,000 today, making that psychological level an important barrier to watch.
The oscillators point to gradually building upside momentum. RSI (14) has moved back above the neutral 50 level, while MACD has staged a bullish crossover of the signal line and turned positive. The speed of the momentum shift is nothing to write home about, but for now it still favours long setups over shorts.
If downtrend resistance from the highs set earlier this year were to break, the next port of call could be 30,245, the swing high set on August 17. Beyond that, there were multiple failures at and above 30,600 earlier this year, extending up to the record high of 30,756.
It may take a more palatable macro backdrop than the one we have now to get there. But with earnings season approaching, such a move is not out of the realms of possibility.
Of course, if the breakout fizzles and the price moves back below 29,670, it would point to the risk of a resumption of sideways range trade between 29,670 on the topside and 28,875 on the downside, with the 50- and 100-day moving averages providing reference levels in between.
Latest market news




Open an account in minutes
Experience award-winning platforms with fast and secure execution, and enjoy tight spreads from 0.5 pts on FX and 0.3 pts on indices.
Economic calendar
Web Trader platform
Our sophisticated web-based platform is packed with features.
Related articles
Canadian Dollar Short-term Outlook: USD/CAD Five-Week Rally Hits a Wall at Major Resistance 10 14 2026
USD/CAD is holding near fresh yearly highs, but bearish divergence and a well-defined October range raise the stakes at major resistance.
Stocks on Watch After CPI-Fueled Breakdown: SPX, Nasdaq, NVDA
Coming into the week there was an early case of divergence as AI and tech had started to show lag behind the S&P. That shift is growing more noticeable following a higher-than-expected CPI print.

Nasdaq 100 Forecast: NDX falls after hotter inflation data
U.S. stocks are falling after hotter-than-expected U.S. inflation data, which has lifted Fed rate hike expectations.

This report is intended for general circulation only. It should not be construed as a recommendation, or an offer (or solicitation of an offer) to buy or sell any financial products. The information provided does not take into account your specific investment objectives, financial situation or particular needs. Before you act on any recommendation that may be contained in this report, independent advice ought to be sought from a financial adviser regarding the suitability of the investment product, taking into account your specific investment objectives, financial situation or particular needs.
StoneX Financial Pte. Ltd., may distribute reports produced by its respective foreign entities or affiliates within the StoneX group of companies or third parties pursuant to an arrangement under Regulation 32C of the Financial Advisers Regulations. Where the report is distributed to a person in Singapore who is not an accredited investor, expert investor or an institutional investor (as defined in the Securities Futures Act), StoneX Financial Pte. Ltd. accepts legal responsibility to such persons for the contents of the report only to the extent required by law. Singapore recipients should contact StoneX Financial Pte. Ltd. at 6826 9988 for matters arising from, or in connection with the report.
In the case of all other recipients of this report, to the extent permitted by applicable laws and regulations neither StoneX Financial Pte. Ltd. nor its associated companies will be responsible or liable for any loss or damage incurred arising out of, or in connection with, any use of the information contained in this report and all such liability is hereby expressly disclaimed. No representation or warranty is made, express or implied, that the content of this report is complete or accurate.
StoneX Financial Pte. Ltd. is not under any obligation to update this report.
Trading CFDs carries a high level of risk that may not be suitable for some investors. Consider your investment objectives, level of experience, financial resources, risk appetite and other relevant circumstances carefully. The possibility exists that you could lose some or all of your investments, including your initial deposits. If in doubt, please seek independent expert advice. Visit www.forex.com/en-sg/terms-and-policies for the complete Risk Disclosure Statement.