



Nasdaq Eyes Breakout as Yields, Dollar and Volatility Ease
Nasdaq is already benefiting from softer yields, DXY and VXN. A payrolls outcome that extends those trends would add weight to the bullish breakout case.
Share this:
- US financial conditions have eased in recent days
- Nasdaq has responded, rebounding into a resistance zone
- Persistent easing has historically delivered stronger forward returns
- Friday’s payrolls report may determine whether the bullish move extends
We’ve seen a short-term easing in US financial conditions which has coincided with a rebound in the Nasdaq, leaving the index sitting just beneath a key technical resistance zone heading into Friday’s August payrolls report.
Financial Conditions Turn in Nasdaq’s Favour
Source: TradingView, LSEG, FOREX.com
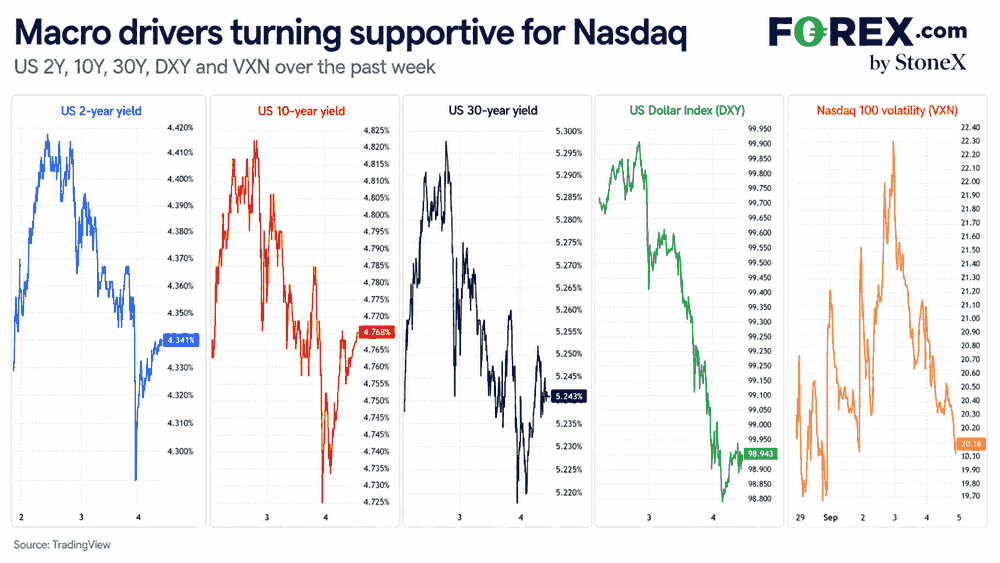
Over the past week, Treasury yields have pulled back across the curve, the US dollar has weakened and VXN, the Nasdaq equivalent of the S&P 500 volatility index, or VIX, has also reversed from levels seen earlier in the week.
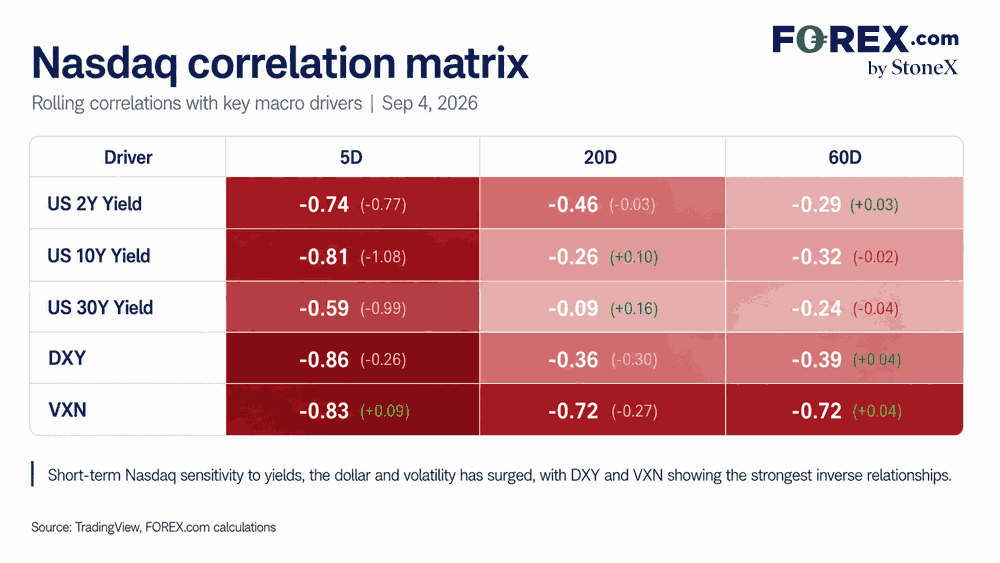
The tailwinds this has created for Nasdaq are evident in the correlation matrix below, showing the strength of the inverse relationship with yields, DXY and VXN, particularly over shorter timeframes.
Source: TradingView, FOREX.com
Put simply, as they have fallen, Nasdaq has often done the opposite.
While that has provided a short-term tailwind, backtesting suggests the persistence of easing financial conditions typically matters more than the initial shift itself.
Persistence Matters More Than the Initial Move
Source: TradingView, LSEG, FOREX.com
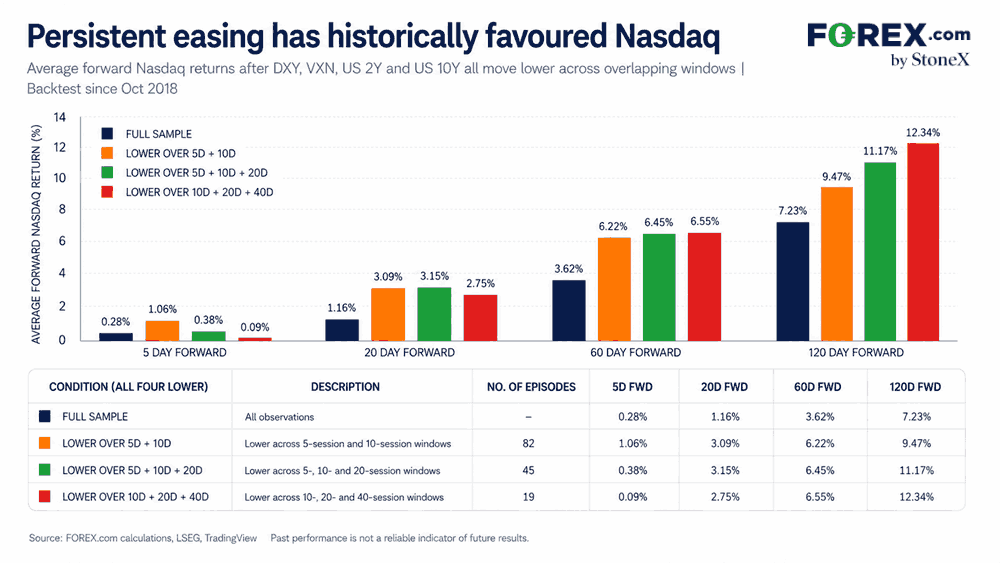
Looking at periods since late 2018 when DXY, VXN and the US 2 and 10-year yields were all falling together, Nasdaq’s forward returns improved as easing became more persistent, outperforming the broader sample over the same forward periods.
When all four were lower across five and 10-session windows, Nasdaq averaged gains of around 3.1% over the following 20 sessions, 6.2% over 60 sessions and 9.5% over 120 sessions, compared with full-sample averages of roughly 1.2%, 3.6% and 7.2%.
When the easing persisted across 10, 20 and 40-session windows, the average 60 and 120 session gains increased to around 6.6% and 12.3% respectively, again comfortably above the broader historical averages.
While strong earnings growth tied to the AI buildout has clearly been a major force behind Nasdaq’s gains, the backtesting suggests financial conditions matter too. When yields, the dollar and volatility ease together and stay lower, the index has historically performed better, pointing to macro conditions as another important driver of overall performance.
Payrolls Could Extend the Easing
That puts greater emphasis on Friday’s US non-farm payroll report, given it carries the potential to vastly impact financial conditions depending on the outcome.
August has historically been a weak month for payrolls relative to forecast, while the recent labour market has also been marked by an extraordinary run of declines in labour force participation. That has helped cap the unemployment rate even as hiring has weakened sharply, in part due to changes in labour supply and immigration.
If we were to see a pop in the participation rate without a commensurate lift in employment in the household survey, it would create upside risk for the unemployment rate regardless of how payrolls prints in the establishment survey. That would likely weigh on Treasury yields and DXY, while also putting downward pressure on VXN.
That would create the kind of backdrop that has recently worked in Nasdaq’s favour and, if the easing persists, the backtesting suggests the support could extend well beyond the immediate reaction.
Of course, the opposite may apply if we get a blowout jobs report. A stronger payrolls outcome, or a result that keeps the unemployment rate contained, could push yields and DXY higher again, tightening financial conditions and potentially limiting upside for the index.
Nasdaq Jammed Beneath Resistance
Source: TradingView
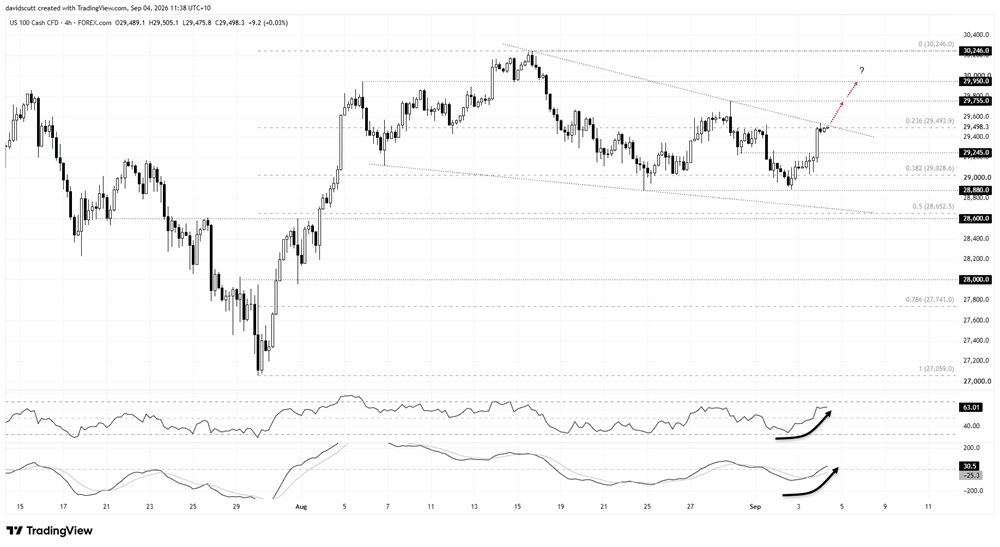
That backdrop creates an interesting setup for the Nasdaq heading into the payrolls report, with the index now jammed against a confluence of resistance comprising the downtrend running from the highs set in the middle of August, along with the 23.6% Fibonacci retracement of the July to August bull move.
With RSI (14) pushing higher away from the neutral 50 level and MACD flipping positive, having already crossed the signal line, the message is that upside momentum is building, favouring long setups over shorts.
If we see a sustained break above the confluence of the 23.6% Fib and downtrend resistance around 29,500, it would allow for a setup where longs could be established with a tight stop beneath the confluence zone for protection, targeting a potential retest of the highs hit in August. Levels of note along the way that could act as potential targets, depending on desired risk-reward, include 29,755, the high set on August 28, 29,950, which has acted as support and resistance at various points this year, along with the August peak of 30,246.
Of course, if the index cannot break above the resistance zone, there is also the option to initiate shorts beneath it with a tight stop above for protection, targeting either 29,245 or the 38.2% Fibonacci retracement of the July to August bull move initially.
Latest market news




Open an account in minutes
Experience award-winning platforms with fast and secure execution, and enjoy tight spreads from 0.5 pts on FX and 0.3 pts on indices.
Economic calendar
Web Trader platform
Our sophisticated web-based platform is packed with features.
Related articles
Canadian Dollar Short-term Outlook: USD/CAD Five-Week Rally Hits a Wall at Major Resistance 10 14 2026
USD/CAD is holding near fresh yearly highs, but bearish divergence and a well-defined October range raise the stakes at major resistance.

Stocks on Watch After CPI-Fueled Breakdown: SPX, Nasdaq, NVDA
Coming into the week there was an early case of divergence as AI and tech had started to show lag behind the S&P. That shift is growing more noticeable following a higher-than-expected CPI print.


USD/JPY forecast: hot US CPI lifts the pair above its 200-day average
Hotter-than-expected US inflation has pushed USD/JPY above its 200-day moving average, putting 160 and the risk of Bank of Japan intervention back in focus. The breakout still needs to hold, and a failure could send the pair sharply lower.

This report is intended for general circulation only. It should not be construed as a recommendation, or an offer (or solicitation of an offer) to buy or sell any financial products. The information provided does not take into account your specific investment objectives, financial situation or particular needs. Before you act on any recommendation that may be contained in this report, independent advice ought to be sought from a financial adviser regarding the suitability of the investment product, taking into account your specific investment objectives, financial situation or particular needs.
StoneX Financial Pte. Ltd., may distribute reports produced by its respective foreign entities or affiliates within the StoneX group of companies or third parties pursuant to an arrangement under Regulation 32C of the Financial Advisers Regulations. Where the report is distributed to a person in Singapore who is not an accredited investor, expert investor or an institutional investor (as defined in the Securities Futures Act), StoneX Financial Pte. Ltd. accepts legal responsibility to such persons for the contents of the report only to the extent required by law. Singapore recipients should contact StoneX Financial Pte. Ltd. at 6826 9988 for matters arising from, or in connection with the report.
In the case of all other recipients of this report, to the extent permitted by applicable laws and regulations neither StoneX Financial Pte. Ltd. nor its associated companies will be responsible or liable for any loss or damage incurred arising out of, or in connection with, any use of the information contained in this report and all such liability is hereby expressly disclaimed. No representation or warranty is made, express or implied, that the content of this report is complete or accurate.
StoneX Financial Pte. Ltd. is not under any obligation to update this report.
Trading CFDs carries a high level of risk that may not be suitable for some investors. Consider your investment objectives, level of experience, financial resources, risk appetite and other relevant circumstances carefully. The possibility exists that you could lose some or all of your investments, including your initial deposits. If in doubt, please seek independent expert advice. Visit www.forex.com/en-sg/terms-and-policies for the complete Risk Disclosure Statement.