



RIO FY 2021 Earnings Preview: Where next for RIO stock?
Rio Tinto Group (RIO) is the world's second-largest metals and mining corporation by market capitalisation behind BHP, producing iron ore, copper, diamonds, gold, and uranium.
Share this:

RIO is a dual-listed company traded on both the London Stock Exchange and the Australian Stock Exchange. It is due to report its full-year 2021 results on Wednesday, February 23.
Iron ore accounts for just over 80% of RIO’s underlying earnings (Underlying EBITA). Robust demand for iron ore from China and other parts of the world during the first half of 2021 pushed the iron ore price above $US230 per tonne in May of 2021.
The surge in the iron ore price propelled the share price of RIO to a record high of $137.77. It enabled the company to report a 124% jump in earnings from its iron ore operation and a whopping $US561c per share interim dividend at its interim earnings report for the period ending June 30.
The report highlighted some blemishes, including an uphill battle to hit production targets. At its third-quarter production result handed down in mid-October, the company downgraded guidance, including that from its flagship iron ore operations.
“We now expect Pilbara shipments to be 320 to 325 million tonnes (previously at the low end of 325 to 340 million tonnes) following modest delays to completion of the new greenfield mine at Gudai-Darri and the Robe Valley brownfield mine replacement project due to the tight labour market in Western Australia.”
The other major challenge that the company has faced is a plunge in the iron ore price to below $90 per tonne in late November as the Chinese economy stalled following a regulatory reset that impacted the real estate market and steel production.
Rio Tinto’s full-year earnings are expected to be $US21.7 billion NPAT, and a dividend payout of $US439c per share, putting the company on a projected dividend yield of over 10%!!
Rio Tinto shares will trade ex-dividend on March 10. This is when investors must have purchased the company’s shares to be eligible for the upcoming dividend payment.
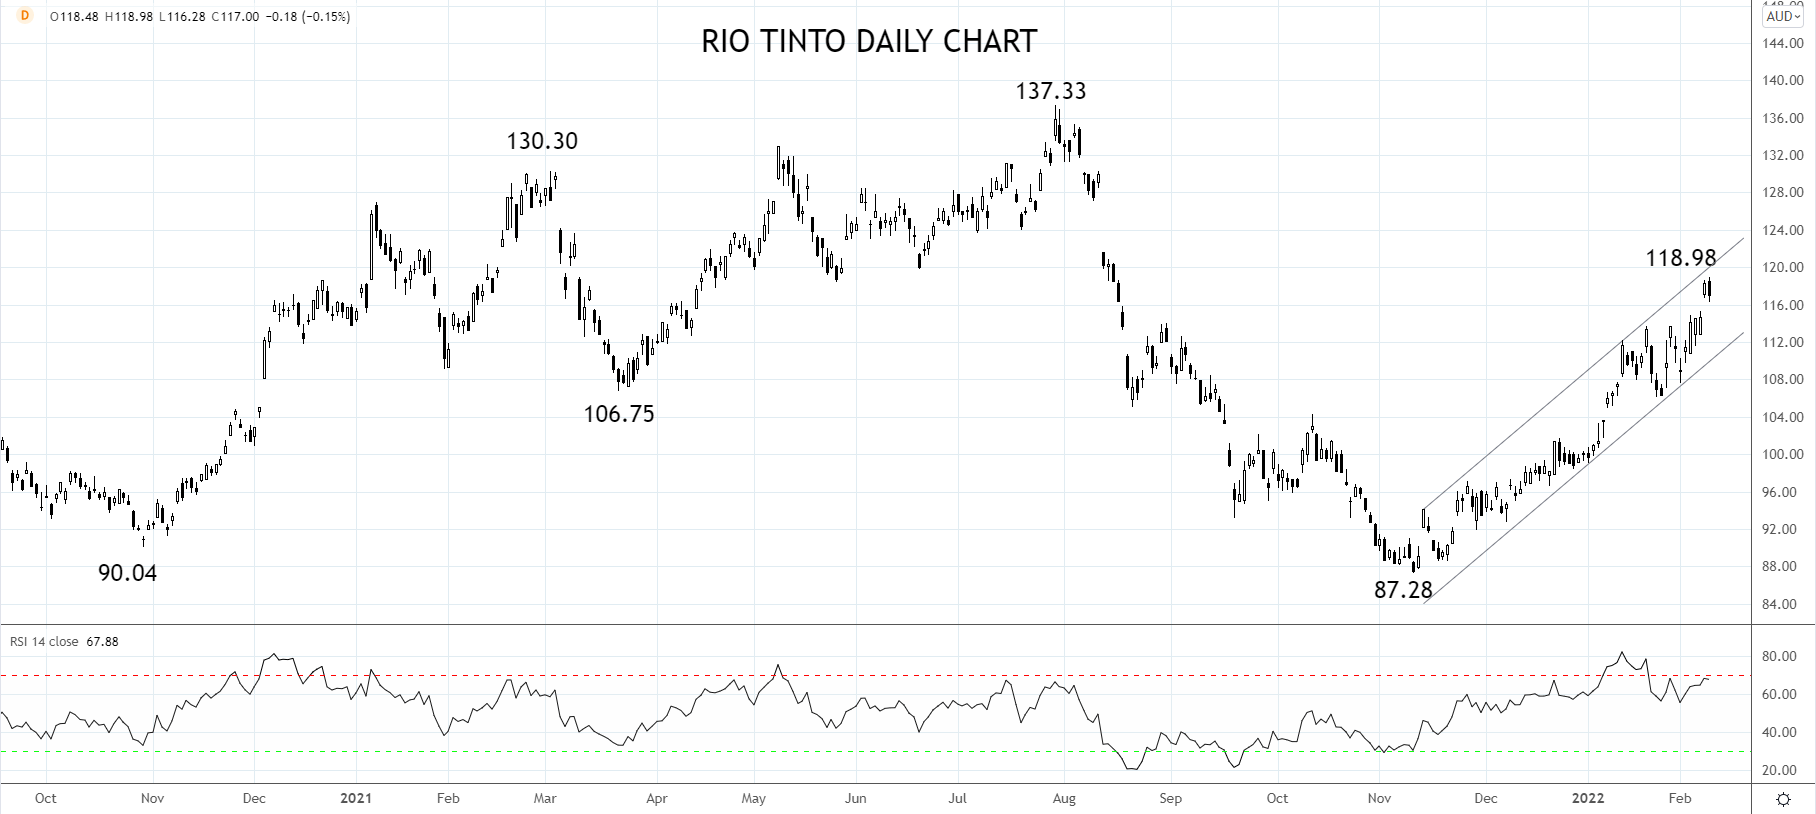
RIO Share Price Chart
The share price of RIO has tracked the iron ore price over the past six months, falling ~35% from its June high of $137.33 to its $87.28 low in November.
Following an easing in Chinese monetary policy in early December, the price of iron ore has rallied, and by extension, so to the share price of RIO.
As the easing in Chinese monetary policy is expected to remain supportive, the preference is to buy RIO on dips back towards trend channel support at $110.00, looking for the price to rally towards $125 in the coming months.
Source Tradingview. The figures stated areas of February 9 2022. Past performance is not a reliable indicator of future performance. This report does not contain and is not to be taken as containing any financial product advice or financial product recommendation
How to trade with City Index
You can trade with City Index by following these four easy steps:
- Open an account, or log in if you’re already a customer
• Open an account in the UK
• Open an account in Australia
• Open an account in Singapore
- Search for the company you want to trade in our award-winning platform
- Choose your position and size, and your stop and limit levels
- Place the trade
RIO is a dual-listed company traded on both the London Stock Exchange and the Australian Stock Exchange. It is due to report its full-year 2021 results on Wednesday, February 23.
Iron ore accounts for just over 80% of RIO’s underlying earnings (Underlying EBITA). Robust demand for iron ore from China and other parts of the world during the first half of 2021 pushed the iron ore price above $US230 per tonne in May of 2021.
The surge in the iron ore price propelled the share price of RIO to a record high of $137.77. It enabled the company to report a 124% jump in earnings from its iron ore operation and a whopping $US561c per share interim dividend at its interim earnings report for the period ending June 30.
The report highlighted some blemishes, including an uphill battle to hit production targets. At its third-quarter production result handed down in mid-October, the company downgraded guidance, including that from its flagship iron ore operations.
“We now expect Pilbara shipments to be 320 to 325 million tonnes (previously at the low end of 325 to 340 million tonnes) following modest delays to completion of the new greenfield mine at Gudai-Darri and the Robe Valley brownfield mine replacement project due to the tight labour market in Western Australia.”
The other major challenge that the company has faced is a plunge in the iron ore price to below $90 per tonne in late November as the Chinese economy stalled following a regulatory reset that impacted the real estate market and steel production.
Rio Tinto’s full-year earnings are expected to be $US21.7 billion NPAT, and a dividend payout of $US439c per share, putting the company on a projected dividend yield of over 10%!!
Rio Tinto shares will trade ex-dividend on March 10. This is when investors must have purchased the company’s shares to be eligible for the upcoming dividend payment.
RIO Share Price Chart
The share price of RIO has tracked the iron ore price over the past six months, falling ~35% from its June high of $137.33 to its $87.28 low in November.
Following an easing in Chinese monetary policy in early December, the price of iron ore has rallied, and by extension, so to the share price of RIO.
As the easing in Chinese monetary policy is expected to remain supportive, the preference is to buy RIO on dips back towards trend channel support at $110.00, looking for the price to rally towards $125 in the coming months.
Source Tradingview. The figures stated areas of February 9 2022. Past performance is not a reliable indicator of future performance. This report does not contain and is not to be taken as containing any financial product advice or financial product recommendation
- Open a Forex.com account, or log in if you’re already a customer.
- Search for the pair you want to trade in our award-winning platform.
- Choose your position and size, and your stop and limit levels.
- Place the trade.
Related tags:
Latest market news



Open an account in minutes
Experience award-winning platforms with fast and secure execution, and enjoy tight spreads from 0.5 pts on FX and 0.3 pts on indices.
Economic calendar
Web Trader platform
Our sophisticated web-based platform is packed with features.
Related articles

ASX 200 Slides as Oil, Yields and Rate Risks Hit Sentiment
The ASX 200 suffered its worst week in six months as surging oil, higher bond yields and renewed rate-hike bets drove a broad risk-off move.


GBP/USD, Dow Jones Forecast: Key Technical Scenarios to Watch
GBP/USD and the Dow Jones are approaching critical technical levels amid earning optimism, Fed rate hike expectations, US-Iran developments, and persistent geopolitical risks.


Cyclical stocks sniff out better times ahead
Different economies, different drivers, similar price action. The German DAX, ASX 200 and Russell 2000 are all hinting at a more optimistic view on the global economy.

This report is intended for general circulation only. It should not be construed as a recommendation, or an offer (or solicitation of an offer) to buy or sell any financial products. The information provided does not take into account your specific investment objectives, financial situation or particular needs. Before you act on any recommendation that may be contained in this report, independent advice ought to be sought from a financial adviser regarding the suitability of the investment product, taking into account your specific investment objectives, financial situation or particular needs.
StoneX Financial Pte. Ltd., may distribute reports produced by its respective foreign entities or affiliates within the StoneX group of companies or third parties pursuant to an arrangement under Regulation 32C of the Financial Advisers Regulations. Where the report is distributed to a person in Singapore who is not an accredited investor, expert investor or an institutional investor (as defined in the Securities Futures Act), StoneX Financial Pte. Ltd. accepts legal responsibility to such persons for the contents of the report only to the extent required by law. Singapore recipients should contact StoneX Financial Pte. Ltd. at 6826 9988 for matters arising from, or in connection with the report.
In the case of all other recipients of this report, to the extent permitted by applicable laws and regulations neither StoneX Financial Pte. Ltd. nor its associated companies will be responsible or liable for any loss or damage incurred arising out of, or in connection with, any use of the information contained in this report and all such liability is hereby expressly disclaimed. No representation or warranty is made, express or implied, that the content of this report is complete or accurate.
StoneX Financial Pte. Ltd. is not under any obligation to update this report.
Trading CFDs carries a high level of risk that may not be suitable for some investors. Consider your investment objectives, level of experience, financial resources, risk appetite and other relevant circumstances carefully. The possibility exists that you could lose some or all of your investments, including your initial deposits. If in doubt, please seek independent expert advice. Visit www.forex.com/en-sg/terms-and-policies for the complete Risk Disclosure Statement.