


Cyclical stocks sniff out better times ahead
Different economies, different drivers, similar price action. The German DAX, ASX 200 and Russell 2000 are all hinting at a more optimistic view on the global economy.
Share this:

- DAX breaks to fresh record highs
- ASX 200 clears late July resistance
- Russell 2000 snaps month-long downtrend
DAX, ASX 200 and Russell charts align
The German DAX, Australia's ASX 200 and Russell 2000 in the States don't have much in common. Different economies, different sector weightings and different domestic drivers. Yet over recent sessions, the price action has started to look remarkably similar.
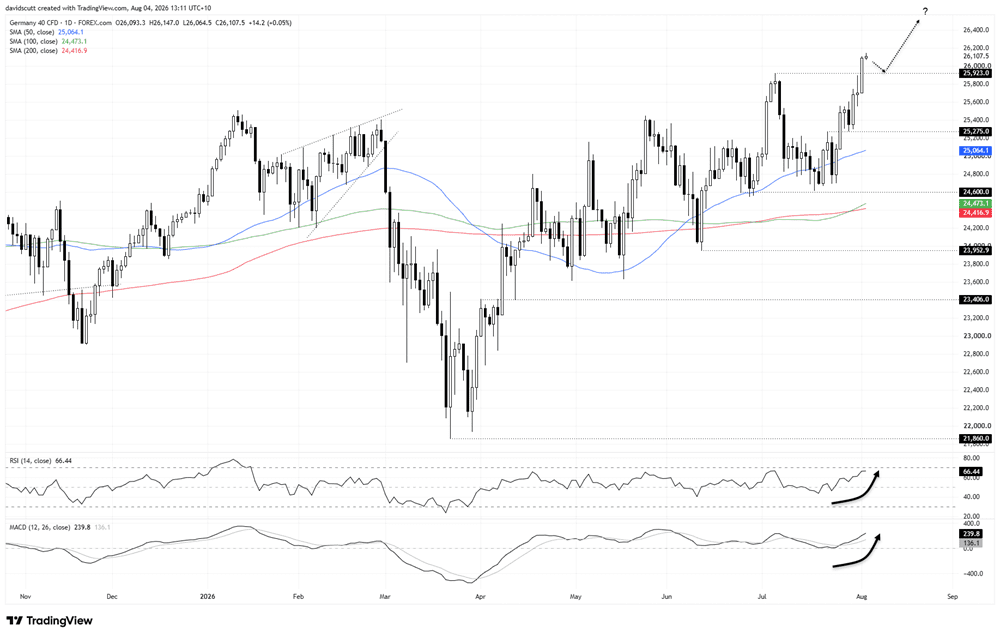
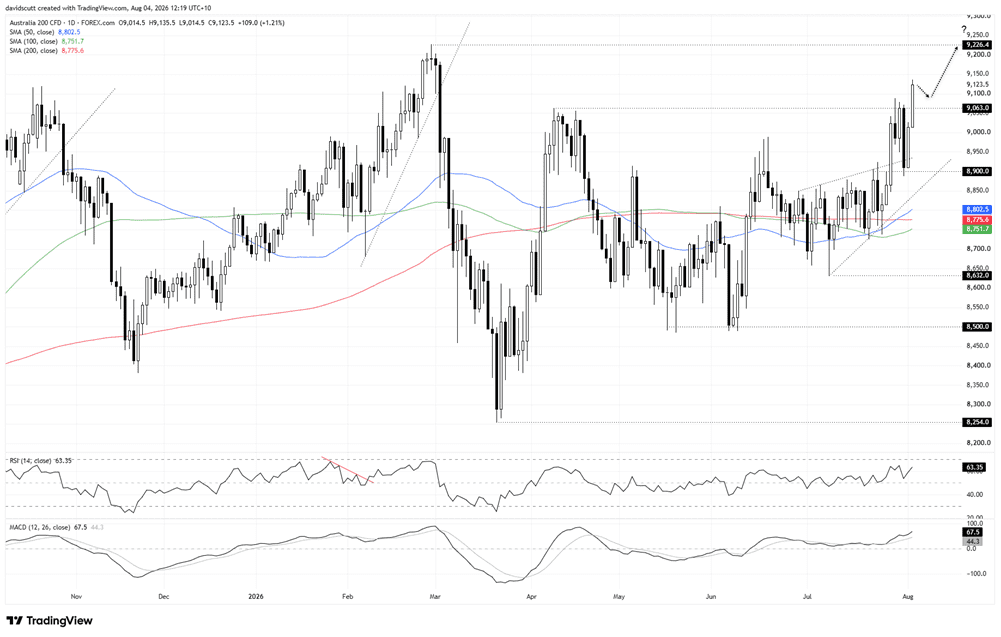
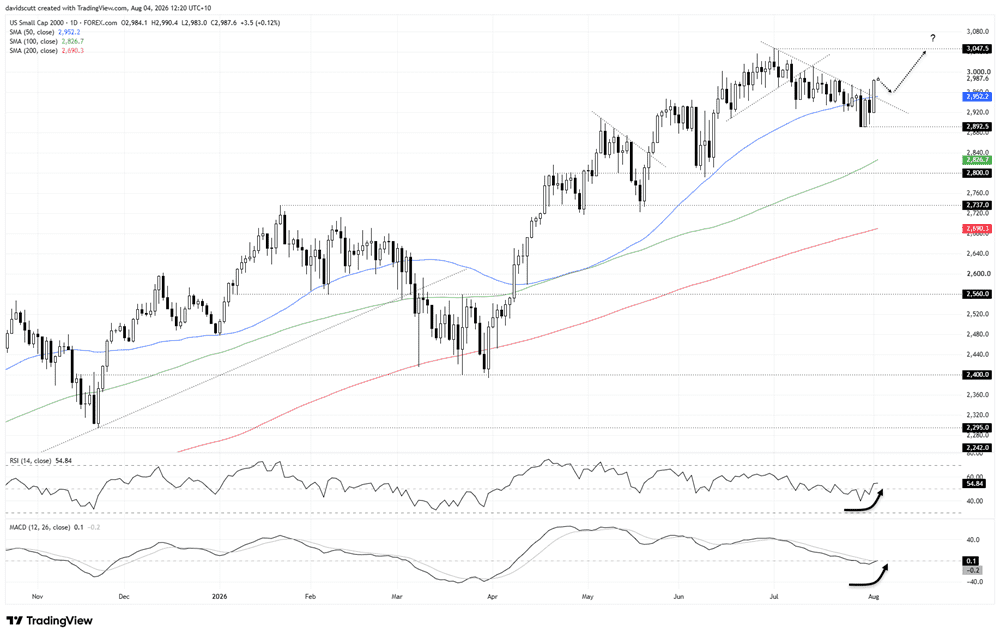
The DAX has broken to fresh record highs, the ASX 200 has pushed above the highs set in late July, while the Russell has broken above the downtrend that's capped rallies over the past month.
As anyone who's watched them for a significant period can attest, markets don't wait for economists or data to tell them the outlook is changing. They often move first. Looking at these charts together, it feels like they're starting to price a brightening macroeconomic picture.
Maybe it's the recent slide in energy prices on what feels like eternal Middle East peace hopes. Maybe it's the view that the recent intervention episode to support the yen has reduced one of the risks that had been building in global bond markets. Maybe traders think the highs are in for inflation. Or maybe it's something else like the return of liquidity post month-end.
Whatever the reason, it's difficult to ignore that these cyclical plays are starting to behave in a similar fashion. While it could prove to be yet another false dawn, when the charts start lining up like this, it’s worth paying attention.
DAX breaks to fresh record highs
Source: TradingView
Germany's DAX has broken to fresh record highs after clearing resistance at 25,923, extending the bull move that's been building since the rebound from 24,600. The breakout above 25,275 and subsequent backtest added conviction that buyers remained in control.
The broader technical picture continues to favour upside. The price trades above rising key medium and long-term moving averages, RSI (14) is pushing higher at 66 without being overbought, while MACD has staged a bullish crossover and continues to strengthen in positive territory.
The setup therefore favours bulls. I just don't see enough to justify chasing fresh record highs right now.
For one, the last break to record highs earlier this year fizzled quickly. Secondly, the macro backdrop may prove just as important as the technicals when it comes to the breakout's longevity.
Germany remains heavily reliant on imported energy, meaning the recent slide in crude oil prices on hopes of a lasting Middle East peace deal has provided a near-term tailwind. But whether it lasts, or simply proves to be another false dawn in this ongoing geopolitical saga, may determine whether this breakout sticks.
While some may be prepared to buy the breakout immediately, I'd rather wait for a backtest of 25,923. If former resistance flips to support, it would provide far greater confidence that this is a genuine breakout to chase.
At record highs, trying to pick an upside target feels like guesswork. Instead, I'll be watching for reversal patterns on the daily timeframe, such as a bearish engulfing pattern, shooting star, evening star or key reversal, as an early warning that the bull move may be running out of steam.
ASX 200 bulls eye record highs
Source: TradingView
While the ASX 200's price action isn't always the cleanest, it's obvious the bulls are winning the battle right now.
The index has rebounded strongly from 8,900, a level that's acted as both support and resistance over recent weeks, before surging above 9,063 today. That follows several failed attempts to clear the level last week, adding to confidence that buyers are finally regaining control.
The oscillators are also on board. RSI (14) sits at 63, still short of overbought territory and pointing to building upside momentum, while MACD has staged a bullish crossover and continues to diverge from its signal line in positive territory.
Like the DAX, some may be prepared to buy the breakout immediately. Given the risk of another escalation in geopolitical tensions that could quickly challenge the narrative, I'd rather wait for a backtest of the former resistance zone between 9,063 and 9,100. The area attracted plenty of price action late last year and again in recent weeks, making it an important zone to watch. If it flips to support, longs could be considered with a tight stop below 9,063, targeting a retest of the record high at 9,226.4.
Russell 2000 joins the breakout club
Source: TradingView
The Russell 2000 broke above the downtrend that had been in place since the start of July on Monday, clearing the 50-day simple moving average in the process.
Again, some may be prepared to buy the breakout immediately. I'd rather wait for a pullback towards 2,960 or the 50-day simple moving average before considering entry. If either holds as support, longs could be considered with a tight stop beneath those levels for protection, targeting a retest of the record high at 3,047.5.
The broader technical picture continues to favour upside. The price trades above all the key medium and long-term moving averages, RSI (14) has shifted back above the neutral 50 level. That view is confirmed by MACD, which has staged a bullish crossover of the signal line and is now moving into positive territory.
Latest market news




Open an account in minutes
Experience award-winning platforms with fast and secure execution, and enjoy tight spreads from 0.5 pts on FX and 0.3 pts on indices.
Economic calendar
Web Trader platform
Our sophisticated web-based platform is packed with features.
Related articles
USD/JPY Weekly Outlook: AI earnings could overshadow the Fed and BoJ
AI sentiment has become a major driver of US Treasury yields and USD/JPY. With Microsoft, Alphabet and Amazon reporting this week, central bank decisions may have competition for traders' attention.
Silver forecast: metals liquidation drags XAG/USD into $50-55 support
Silver has broken its July low and slipped into a long-term support zone as the selling in precious metals deepens. The chart shows where the metal could bottom, and next week's Fed decision may decide whether it does.

Australian Dollar Forecast: AUD/USD Support Reversal Sparks Monthly Range Breakout 10 23 2026
A sharp reversal off key support has fueled the AUD/USD recovery, with resistance now in focus ahead of next week’s Fed decision and Australian CPI.

This report is intended for general circulation only. It should not be construed as a recommendation, or an offer (or solicitation of an offer) to buy or sell any financial products. The information provided does not take into account your specific investment objectives, financial situation or particular needs. Before you act on any recommendation that may be contained in this report, independent advice ought to be sought from a financial adviser regarding the suitability of the investment product, taking into account your specific investment objectives, financial situation or particular needs.
StoneX Financial Pte. Ltd., may distribute reports produced by its respective foreign entities or affiliates within the StoneX group of companies or third parties pursuant to an arrangement under Regulation 32C of the Financial Advisers Regulations. Where the report is distributed to a person in Singapore who is not an accredited investor, expert investor or an institutional investor (as defined in the Securities Futures Act), StoneX Financial Pte. Ltd. accepts legal responsibility to such persons for the contents of the report only to the extent required by law. Singapore recipients should contact StoneX Financial Pte. Ltd. at 6826 9988 for matters arising from, or in connection with the report.
In the case of all other recipients of this report, to the extent permitted by applicable laws and regulations neither StoneX Financial Pte. Ltd. nor its associated companies will be responsible or liable for any loss or damage incurred arising out of, or in connection with, any use of the information contained in this report and all such liability is hereby expressly disclaimed. No representation or warranty is made, express or implied, that the content of this report is complete or accurate.
StoneX Financial Pte. Ltd. is not under any obligation to update this report.
Trading CFDs carries a high level of risk that may not be suitable for some investors. Consider your investment objectives, level of experience, financial resources, risk appetite and other relevant circumstances carefully. The possibility exists that you could lose some or all of your investments, including your initial deposits. If in doubt, please seek independent expert advice. Visit www.forex.com/en-sg/terms-and-policies for the complete Risk Disclosure Statement.