




Rotten Apple heading into the holidays
If Apple continues to have supply chain issues and sees a lack of demand for its iphone 13s, the double whammy should continue.
Share this:

On Wednesday, Apple (AAPL) reportedly told suppliers that there may not be a boost in demand for its iphone 13 heading into 2022 as supply chain issues ease. Apple had originally let investors know that due to problems throughout the supply chain, the production goal will be cut. However, now the bad news is compounded. Letting suppliers know that they may not have to pick up the pace once bottlenecks ease will not only set AAPL back in its forecasts, but it will also set back its suppliers who were previously looking to work double-time to pick up the slack once the supply chain problems are over.
Apple’s share price reached new all-time split-adjusted highs yesterday 170.30, before reversing and closing down 3.62%, near 164.65. Price had been in an orderly, long-term upward sloping channel since August 2020 before breaking above the top trendline yesterday. Price hit the 161.8% Fibonacci extension from the September 7th highs to the October 4th lows at 169.00 before reversing lower and moving back into the channel. Note the RSI was in overbought conditions as well. The candle on the daily timeframe was a shooting star, an indication of a reversal.

Source: Tradingview, Stone X
Trade AAPL now: Login or open a new account!
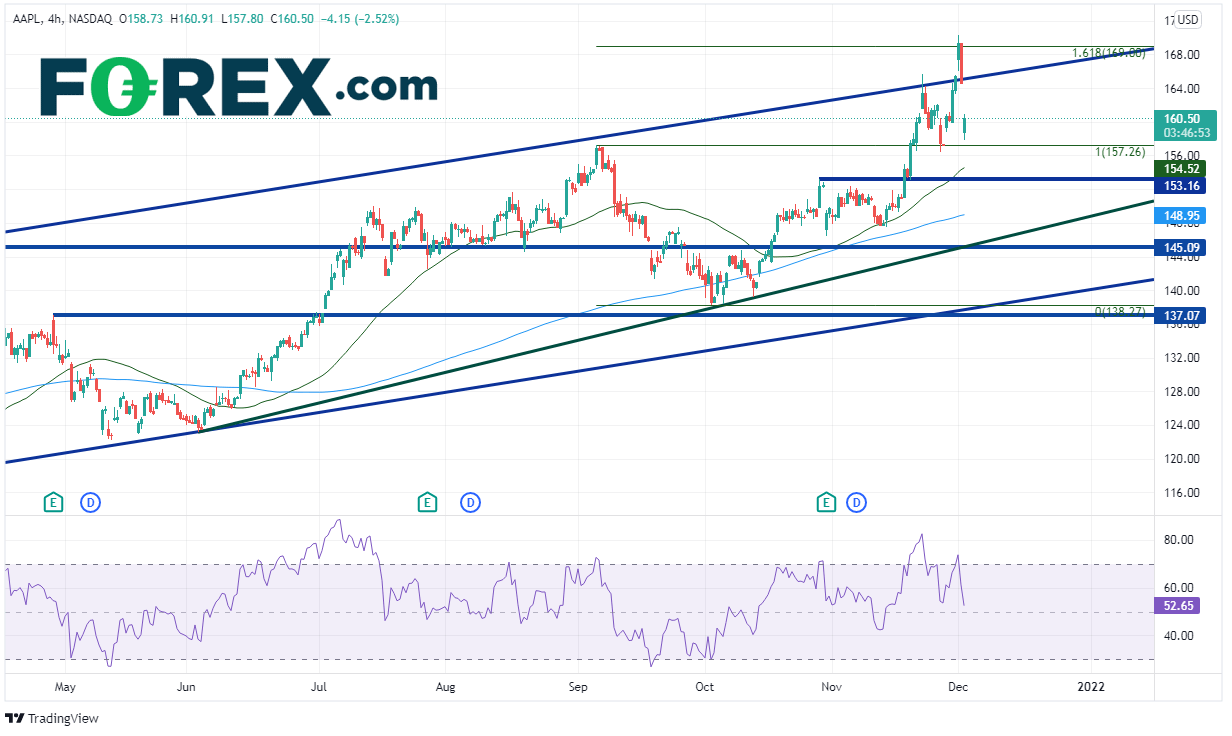
On a 240-minute timeframe, price has been forming higher highs and higher lows within the channel (green line). Today, price gapped lower at the open to 160.25. First resistance is at the gap fill and the top trendline of the long-term channel near 164.53, ahead of yesterdays highs at 170.30. First support is at the November 26th lows and September 8th highs near 156.37. Below there is the 50 Day Moving Average at 154.61 and horizontal support at 153.16. The 200 Day Moving Average is the next support level, down at 148.95. Pay particularly close attention if price reaches the trendlines at 145.09 and 137.07!
Source: Tradingview, Stone X
If Apple continues to have supply chain issues and sees a lack of demand for its iphone 13s, the double whammy should continue. However, don’t forget Apple has other products as well, one of which may be in the EV market in the future!
Learn more about equity trading opportunities.
On Wednesday, Apple (AAPL) reportedly told suppliers that there may not be a boost in demand for its iphone 13 heading into 2022 as supply chain issues ease. Apple had originally let investors know that due to problems throughout the supply chain, the production goal will be cut. However, now the bad news is compounded. Letting suppliers know that they may not have to pick up the pace once bottlenecks ease will not only set AAPL back in its forecasts, but it will also set back its suppliers who were previously looking to work double-time to pick up the slack once the supply chain problems are over.
Apple share price history in recent times
Apple’s share price reached new all-time split-adjusted highs yesterday 170.30, before reversing and closing down 3.62%, near 164.65. Price had been in an orderly, long-term upward sloping channel since August 2020 before breaking above the top trendline yesterday. Price hit the 161.8% Fibonacci extension from the September 7th highs to the October 4th lows at 169.00 before reversing lower and moving back into the channel. Note the RSI was in overbought conditions as well. The candle on the daily timeframe was a shooting star, an indication of a reversal.
Source: Tradingview, Stone X
Trade AAPL now: Login or Open a new account!
• Open an account in the UK
• Open an account in Australia
• Open an account in Singapore
On a 240-minute timeframe, price has been forming higher highs and higher lows within the channel (green line). Today, price gapped lower at the open to 160.25. First resistance is at the gap fill and the top trendline of the long-term channel near 164.53, ahead of yesterdays highs at 170.30. First support is at the November 26th lows and September 8th highs near 156.37. Below there is the 50 Day Moving Average at 154.61 and horizontal support at 153.16. The 200 Day Moving Average is the next support level, down at 148.95. Pay particularly close attention if price reaches the trendlines at 145.09 and 137.07!

Source: Tradingview, Stone X
If Apple continues to have supply chain issues and sees a lack of demand for its iphone 13s, the double whammy should continue. However, don’t forget Apple has other products as well, one of which may be in the EV market in the future!
Learn more about equity trading opportunities.
Related tags:



Open an account in minutes
Experience award-winning platforms with fast and secure execution, and enjoy tight spreads from 0.5 pts on FX and 0.3 pts on indices.
Economic calendar
Web Trader platform
Our sophisticated web-based platform is packed with features.
Related articles

USD/JPY forecast: US dollar strengths amid hawkish Fed despite recent oil weakness
The US dollar has extended its gains this morning, even if oil prices finished lower for the fifth consecutive day yesterday. Oil prices have bounced back in this first half of today’s session, causing a bit of pressure on currencies that rely on energy imports such as the euro, pound, Swiss franc, and Japanese yen. But it was the dollar that was exerting the most pressure, amid hawkish FedSpeak. Meanwhile, European indices and precious metals were also under a bit of pressure amid the strength of the dollar.


USD/JPY and USD/CHF Could Diverge as CHF/JPY Approaches Resistance
USD/JPY and USD/CHF retain bullish structures, but CHF/JPY resistance could expose a divergence between the two US dollar pairs.

EUR/AUD, GBP/AUD Outlook: Rates, risk and metals reinforce bearish technical case
EUR/AUD and GBP/AUD are coiling near support, with recent correlations suggesting the Aussie’s strength is being driven more by rates, risk and metals than energy.

This report is intended for general circulation only. It should not be construed as a recommendation, or an offer (or solicitation of an offer) to buy or sell any financial products. The information provided does not take into account your specific investment objectives, financial situation or particular needs. Before you act on any recommendation that may be contained in this report, independent advice ought to be sought from a financial adviser regarding the suitability of the investment product, taking into account your specific investment objectives, financial situation or particular needs.
StoneX Financial Pte. Ltd., may distribute reports produced by its respective foreign entities or affiliates within the StoneX group of companies or third parties pursuant to an arrangement under Regulation 32C of the Financial Advisers Regulations. Where the report is distributed to a person in Singapore who is not an accredited investor, expert investor or an institutional investor (as defined in the Securities Futures Act), StoneX Financial Pte. Ltd. accepts legal responsibility to such persons for the contents of the report only to the extent required by law. Singapore recipients should contact StoneX Financial Pte. Ltd. at 6826 9988 for matters arising from, or in connection with the report.
In the case of all other recipients of this report, to the extent permitted by applicable laws and regulations neither StoneX Financial Pte. Ltd. nor its associated companies will be responsible or liable for any loss or damage incurred arising out of, or in connection with, any use of the information contained in this report and all such liability is hereby expressly disclaimed. No representation or warranty is made, express or implied, that the content of this report is complete or accurate.
StoneX Financial Pte. Ltd. is not under any obligation to update this report.
Trading CFDs carries a high level of risk that may not be suitable for some investors. Consider your investment objectives, level of experience, financial resources, risk appetite and other relevant circumstances carefully. The possibility exists that you could lose some or all of your investments, including your initial deposits. If in doubt, please seek independent expert advice. Visit www.forex.com/en-sg/terms-and-policies for the complete Risk Disclosure Statement.