



S&P 500 Analysis: SPX ends the week with positive momentum
A new bullish bias has started to gain relevance in the S&P 500, which is up 2.00% over the last two sessions, mainly supported by corporate earnings that have helped sustain short-term market confidence.
Share this:

A new bullish bias has started to gain relevance in the S&P 500, which is up 2.00% over the last two sessions, mainly supported by corporate earnings that have helped sustain short-term market confidence. However, uncertainty remains around what the Federal Reserve could do over the coming months, and this could pressure the market again later. For now, if positive earnings continue to drive the index’s behavior, buying pressure could remain relevant over the next few trading sessions.


Earnings help support confidence
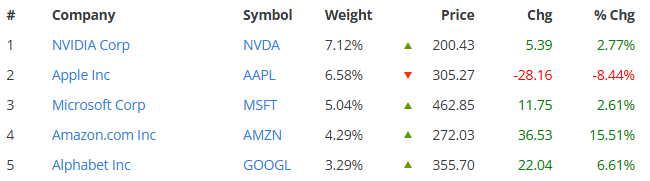
Although the earnings season started with some weakness, especially after companies such as Alphabet raised concerns about elevated artificial intelligence spending, the dynamic changed meaningfully toward the end of the week. Results from companies such as Amazon and Microsoft helped improve market sentiment and reinforced confidence in the stability of some of the index’s largest companies.
In Microsoft’s case, the company reported revenue of 90 billion dollars, representing growth of around 18% year over year. Earnings per share came in at 4.74 dollars, above expectations of 4.24 dollars, while revenue from Azure and other cloud services grew more than 43%. These figures helped restore confidence in the company’s financial stability and potential growth.
Amazon also stood out during the week. The company reported earnings per share of 1.97 dollars, above the 1.82 dollars expected, while revenue surpassed the 200-billion-dollar mark in the latest quarter. The focus was AWS, which grew 37% year over year to 42.2 billion dollars. Amazon said this was the fastest growth rate for AWS in 18 quarters, once again showing strong acceleration in its cloud services business.
To some extent, the results from both companies helped ease concerns about the impact of artificial intelligence spending on major U.S. companies. As two of the most important components of the S&P 500, gains in Microsoft and Amazon helped support demand for the index. This allowed the main components of the SPX to show broadly positive performance toward the final session of the week, with Apple’s weakness standing out as one of the main exceptions after its earnings release.
Source: Slickcharts
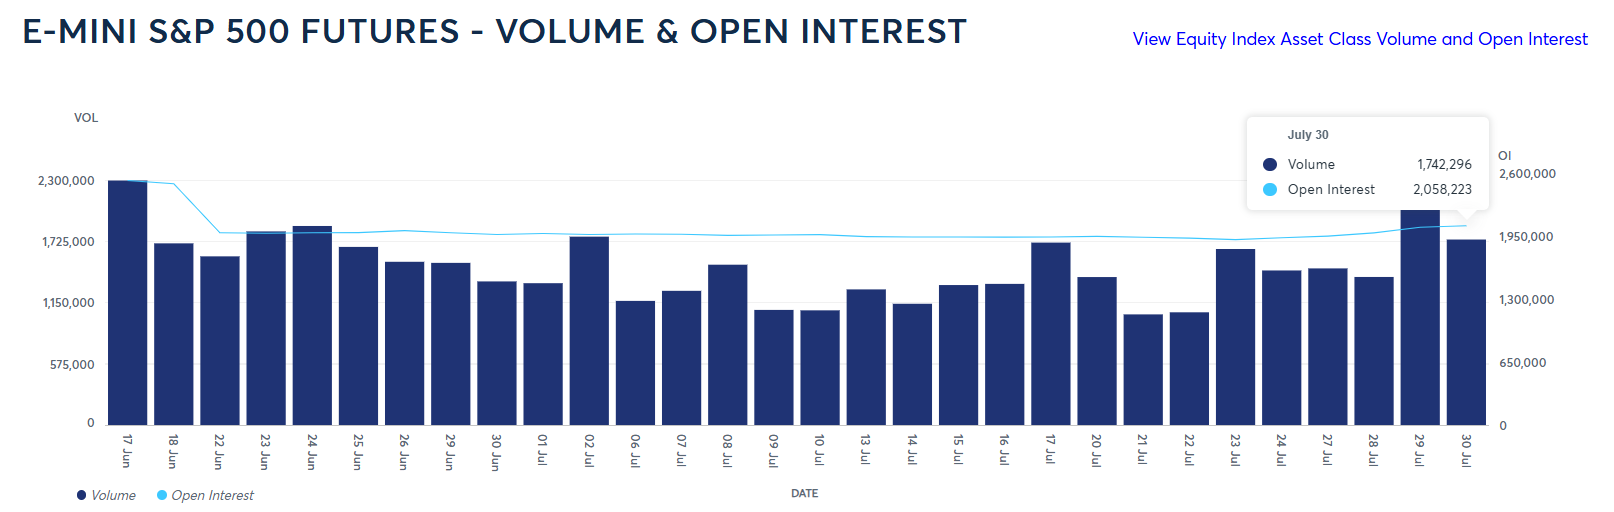
It is also important to note that, after the positive earnings releases, activity in S&P 500 futures regained relevance. In E-mini S&P 500 futures, trading volume on July 30 surpassed 1.7 million contracts, while Open Interest, which measures the total number of open buy and sell positions, also showed a slight increase above 2 million. This dynamic suggests that activity remained solid after strong results from key companies in the index. In addition, the increase in Open Interest alongside the advance in SPX could point to the entry of new buying positions over the last few sessions.
Source: CMEGROUP
With all this in mind, earnings from some companies have helped sustain demand around the index in the short term. However, this impulse could prove temporary if other relevant companies still pending, such as Nvidia, fail to confirm financial stability through their results. If upcoming reports continue to deliver a positive reading, buying pressure could gain more strength; but if signs of weakness begin to appear, the S&P 500 could return to a phase of indecision over the next few trading sessions.
Fed announcements ease tensions
The Federal Reserve’s decision during the week was also relevant. The central bank kept interest rates in the 3.75% reference area, and its comments did not point to a clear urgency to raise rates in the next meetings. Since the market had been expecting a potentially more aggressive stance, the lack of a stronger signal reduced part of the expectations for higher rates in the short term.
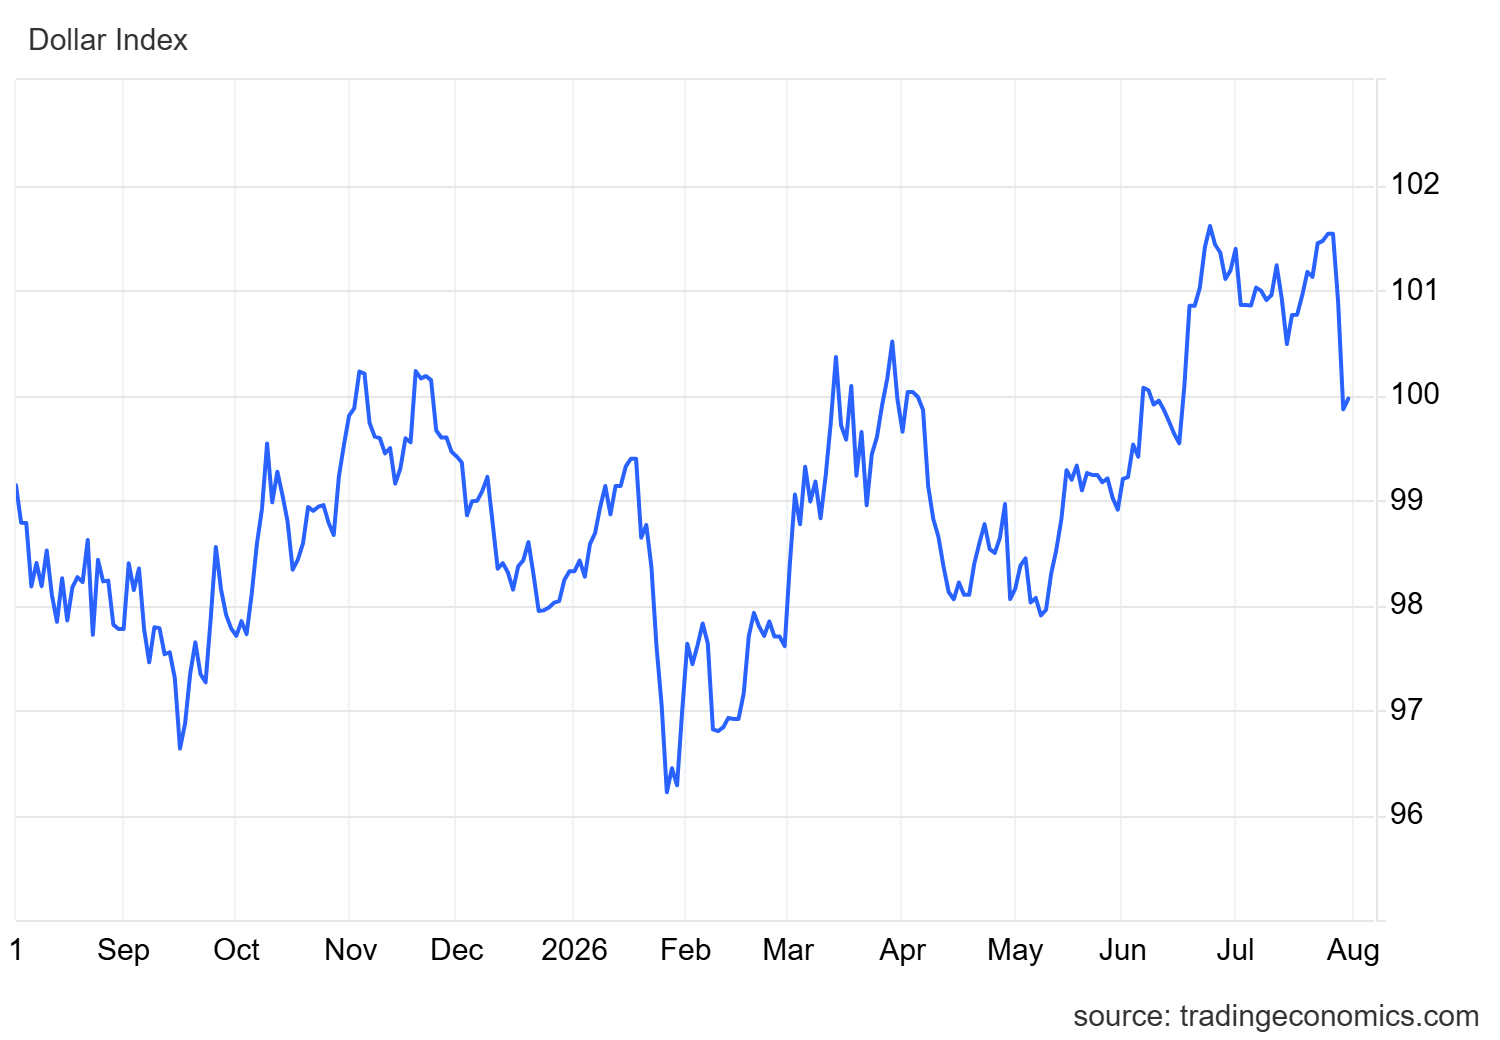
This dynamic started to reduce the appeal of dollar-denominated investments and weighed on demand for the U.S. currency. This was reflected in the DXY index, which measures the dollar’s strength against its main peers. By the end of the week, the index was still showing a relevant decline and was trading slightly below the 100-point area, reflecting weaker short-term demand for the dollar.
Source: TradingEconomics
This move is important because sustained dollar weakness can reflect lower demand for liquidity-driven safe-haven assets and can ease some pressure on risk assets. In addition, if the Fed does not move quickly toward new rate hikes, U.S. consumption could remain more stable, which would be positive for corporate sales and, by extension, for the equity market.
This environment helped stabilize risk appetite in indices such as the S&P 500. However, if the Federal Reserve once again signals possible hikes in September, pressure could return. In that case, the dollar could regain appeal as a substitute market and once again limit demand for risk assets, potentially bringing indecision back into SPX.
S&P 500 technical forecast
Source: StoneX, Tradingview
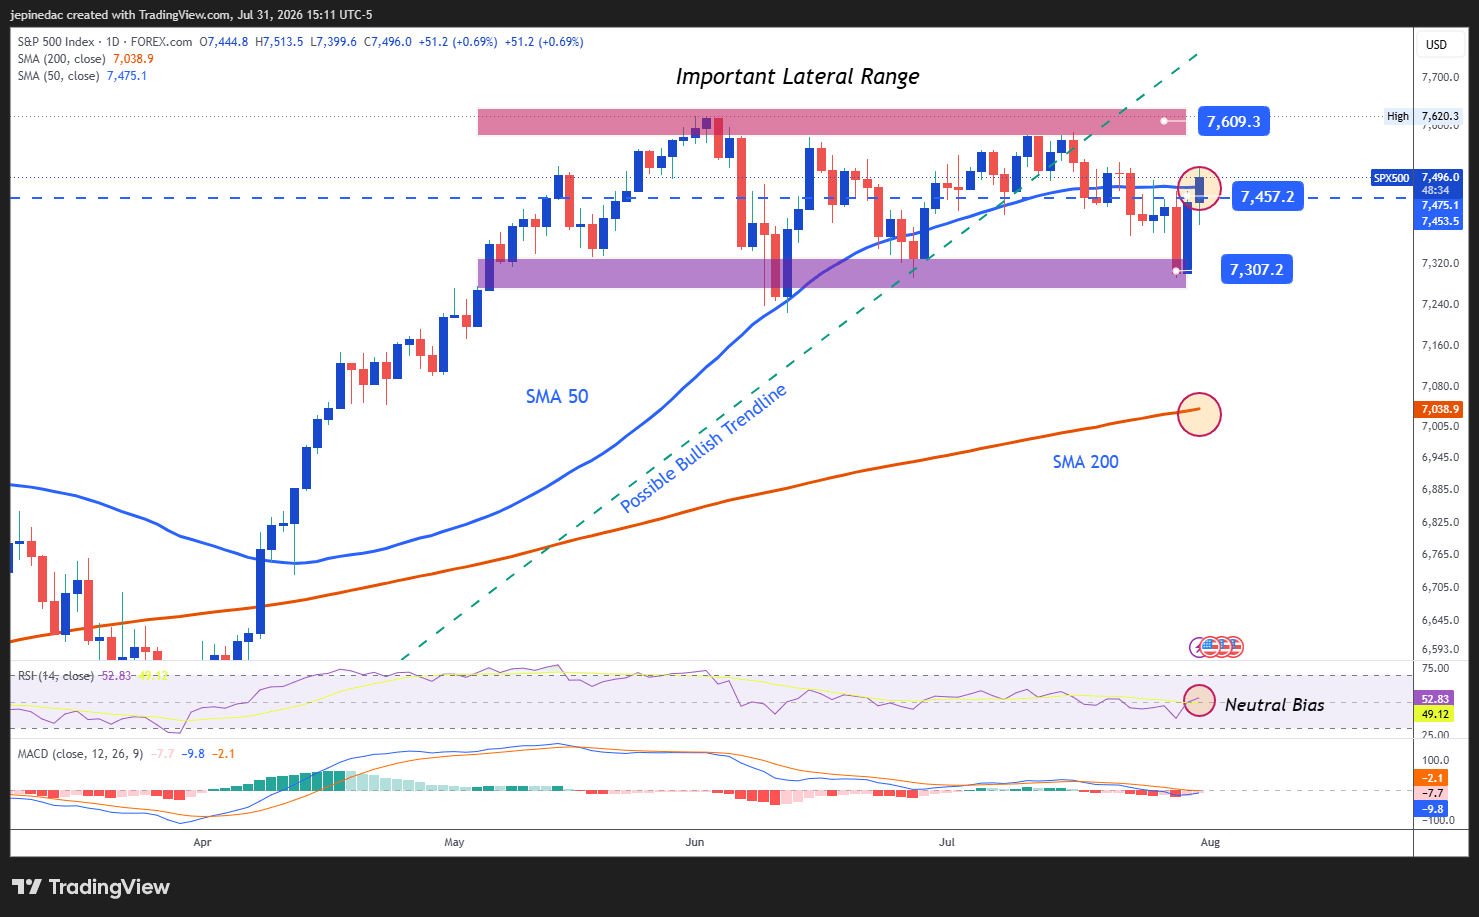
- The sideways range continues to dominate: For several weeks, the S&P 500 has been moving within a relevant sideways range, with an upper barrier near 7,600 points and a lower zone around 7,300 points. Although price has shown a recent recovery, the move has still not been strong enough to define a clear direction outside these levels. For this reason, the sideways range remains the most important technical structure on the chart and could continue to act as the main reference if the market fails to stabilize more consistent buying pressure.
- RSI: Recent RSI movements remain close to the neutral 50 level, suggesting a balance between buying and selling impulses over the last 14 sessions. As long as this behavior continues, price neutrality could remain relevant in the short term.
- MACD: A similar scenario can be seen in the MACD, with the histogram remaining very close to the neutral 0 line. This suggests balance in the strength of short-term moving averages and reinforces the possibility that indecision remains present on the chart.
Key levels:
- 7,600 points – Relevant resistance: This area corresponds to the index’s all-time highs and remains the main bullish reference. A move toward this level could strengthen the buying bias and reactivate the bullish trend seen in previous weeks as a relevant structure for the coming trading weeks.
- 7,450 points – Near-term barrier: This level acts as an important neutral zone, as it coincides with recent pullbacks and the 50-period simple moving average. If price continues to move near this reference, the phase of indecision could extend and keep the sideways range in place as the dominant structure.
- 7,300 points – Key support: This area coincides with relevant lows from recent weeks and remains the main bearish barrier. Sustained moves below this level could reinforce the selling bias and open the door to more consistent downside pressure over the coming weeks.
Written by Julian Pineda, CFA, CMT – Market Analyst
Follow him on: @julianpineda25
Latest market news




Open an account in minutes
Experience award-winning platforms with fast and secure execution, and enjoy tight spreads from 0.5 pts on FX and 0.3 pts on indices.
Economic calendar
Web Trader platform
Our sophisticated web-based platform is packed with features.
Related articles
Pre-CPI USD Price Action Setups: EUR/USD, USD/JPY, GBP/USD, USD/CAD
Tomorrow brings an important inflation print as Treasury yields have started to stall and expectations for rate hikes have pared back. But another jolt to inflation could tilt those odds and impact price action across the USD complex.

S&P 500 Forecast: SPX holds steady as tech stocks decline and banks rise post-earnings
U.S. stocks are mixed ahead of the open on Tuesday, with tech stocks leading the decline as investors also weigh bank earnings.


DXY at Key Resistance as FX Majors Lie in Wait| Weekly Technical Outlook 10 12 2026
Sr. Technical Strategist Michael Boutros highlights the levels that matter on the USD Majors, commodities, and equity indices charts this week.

This report is intended for general circulation only. It should not be construed as a recommendation, or an offer (or solicitation of an offer) to buy or sell any financial products. The information provided does not take into account your specific investment objectives, financial situation or particular needs. Before you act on any recommendation that may be contained in this report, independent advice ought to be sought from a financial adviser regarding the suitability of the investment product, taking into account your specific investment objectives, financial situation or particular needs.
StoneX Financial Pte. Ltd., may distribute reports produced by its respective foreign entities or affiliates within the StoneX group of companies or third parties pursuant to an arrangement under Regulation 32C of the Financial Advisers Regulations. Where the report is distributed to a person in Singapore who is not an accredited investor, expert investor or an institutional investor (as defined in the Securities Futures Act), StoneX Financial Pte. Ltd. accepts legal responsibility to such persons for the contents of the report only to the extent required by law. Singapore recipients should contact StoneX Financial Pte. Ltd. at 6826 9988 for matters arising from, or in connection with the report.
In the case of all other recipients of this report, to the extent permitted by applicable laws and regulations neither StoneX Financial Pte. Ltd. nor its associated companies will be responsible or liable for any loss or damage incurred arising out of, or in connection with, any use of the information contained in this report and all such liability is hereby expressly disclaimed. No representation or warranty is made, express or implied, that the content of this report is complete or accurate.
StoneX Financial Pte. Ltd. is not under any obligation to update this report.
Trading CFDs carries a high level of risk that may not be suitable for some investors. Consider your investment objectives, level of experience, financial resources, risk appetite and other relevant circumstances carefully. The possibility exists that you could lose some or all of your investments, including your initial deposits. If in doubt, please seek independent expert advice. Visit www.forex.com/en-sg/terms-and-policies for the complete Risk Disclosure Statement.