


S&P 500 Analysis: SPX Is Going Through One of Its Most Difficult Periods of 2026
Confidence around the U.S. equity market continues to face significant pressure. Over the last three trading sessions alone, the S&P 500 has fallen nearly 3.3%, highlighting a bearish bias that has become increasingly evident across the broader market.
Share this:

Confidence around the U.S. equity market continues to face significant pressure. Over the last three trading sessions alone, the S&P 500 has fallen nearly 3.3%, highlighting a bearish bias that has become increasingly evident across the broader market. For now, this selling pressure is being driven primarily by expectations of a potentially more aggressive Federal Reserve and persistent concerns surrounding the pace of spending among major U.S. corporations. Both factors have prevented a meaningful recovery in sentiment and continue to weigh on market performance in the near term. As long as these concerns remain in place, selling pressure could continue to be a relevant feature of SPX price action over the coming trading sessions.

Is Risk Appetite Starting to Fade?
One of the main drivers behind the loss of confidence in the equity market is the outlook for U.S. monetary policy over the coming months. Markets continue to price in the possibility of a more aggressive Federal Reserve even after the release of the Fed minutes earlier this week. The minutes revealed that not all policymakers share the same view on keeping interest rates unchanged, while solid economic conditions and persistent inflationary pressures continue to provide room for a more restrictive policy stance in the months ahead.
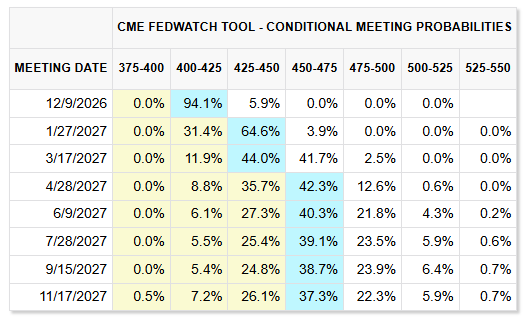
This dynamic is already reflected in market expectations for upcoming Fed meetings. There is currently more than a 94% probability that the December 9 meeting will result in another rate increase. In addition, probabilities for the January 27 meeting continue to exceed 64%, a scenario that could push the Fed's benchmark rate from the current 4.00% toward the 4.50% area during the first months of 2027. Overall, markets continue to lean toward a relatively consistent rate-hiking cycle for the U.S. economy.
Source: CMEGROUP
This matters because a higher interest rate environment tends to increase concerns regarding equity market stability. Elevated rates often raise borrowing costs, affect consumer spending behavior, and can limit growth margins for the companies that make up indices such as the S&P 500. At the same time, higher rates can increase the relative attractiveness of more defensive markets such as the U.S. dollar and the bond market, potentially reducing interest in higher-risk assets.
Another important factor is the ongoing uncertainty surrounding corporate spending. Many companies continue to invest billions of dollars in data centers, technology infrastructure, and artificial intelligence development. However, there is still limited visibility regarding when these elevated levels of investment will begin translating into consistent and sustainable revenue growth.
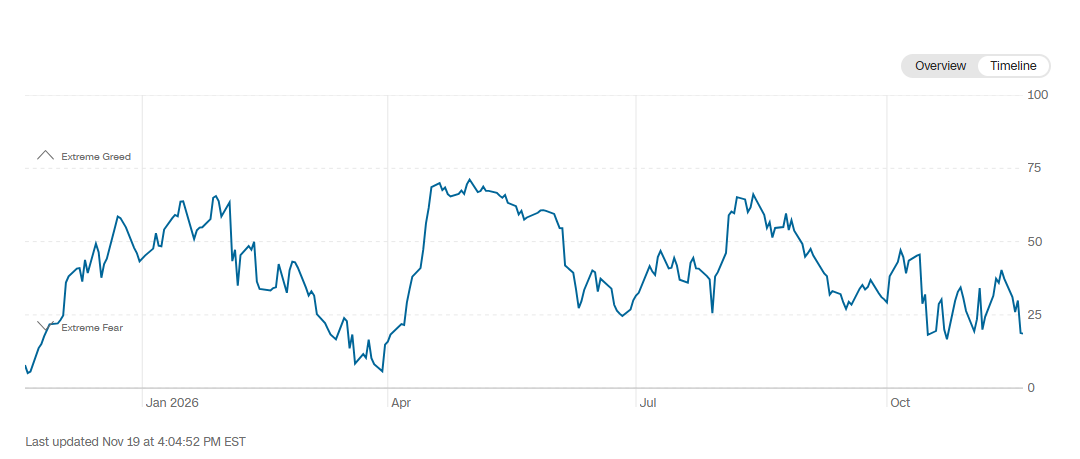
This combination of factors appears to be creating an environment of uncertainty that continues to weigh on equity market confidence. The situation is also reflected in the Fear & Greed Index, which has once again fallen below the 20-point threshold and returned to "Extreme Fear" territory. This behavior suggests that demand for risk assets such as equities remains highly sensitive to concerns surrounding corporate spending and the prospect of an increasingly aggressive Federal Reserve.
Source: CNN
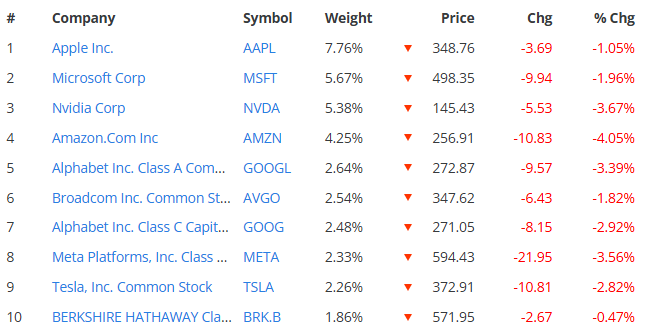
The deterioration in confidence is also becoming visible among the largest components of the S&P 500. During the latest session, none of the ten largest companies in the index managed to post gains, with all of them remaining in negative territory. Amazon fell nearly 4.0%, even after the IPO of Anthropic, a company in which it maintains a significant stake. The weakness, however, was not limited to a single company. Nvidia declined around 3.6%, while Alphabet (Google) lost approximately 3.4%, reflecting a broader deterioration in market sentiment.
What stands out is that this weakness no longer appears concentrated within a single sector or individual company. Instead, selling pressure is being observed relatively evenly across different corners of the market, highlighting that the lack of demand is beginning to affect the U.S. equity market as a whole.
Source: Slickcharts
Taking all of this into account, concerns surrounding corporate spending and expectations of a more aggressive Federal Reserve continue to be the main drivers behind the recent deterioration in confidence across the S&P 500. If both dynamics remain in place, uncertainty could continue to weigh on the market and the bearish bias could remain a relevant feature of SPX price action over the coming trading sessions.
S&P 500 Technical Forecast
Source: StoneX, Tradingview
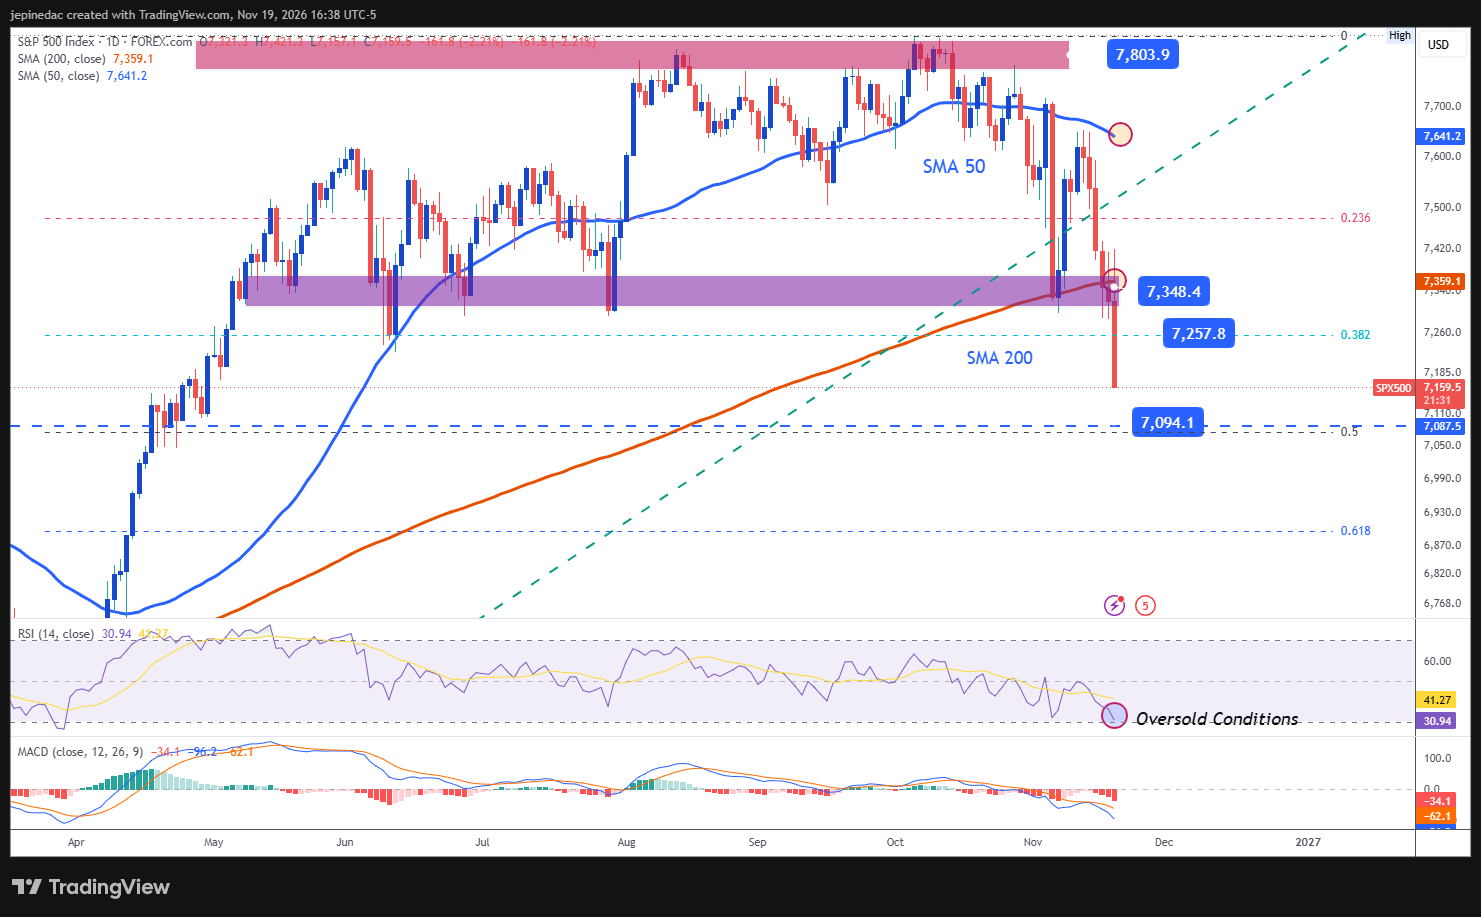
- Bearish momentum becomes increasingly relevant: Until a few weeks ago, SPX was attempting to remain within a relatively well-defined trading range. However, selling pressure has gradually become more dominant, with price action now moving below the 200-period simple moving average, a level often associated with meaningful shifts in market structure. As prices continue approaching important downside barriers, a more well-defined bearish trendline could begin to gain relevance over the coming weeks.
- MACD: The MACD histogram continues to deepen its move below the neutral 0 line, reflecting increasingly relevant bearish momentum in short-term moving averages. As long as this signal remains intact, the bearish bias could continue gaining traction.
- RSI: A similar picture can be observed in the RSI, which remains below the neutral 50 level, highlighting the dominance of selling pressure in recent sessions. However, the magnitude of the decline is also pushing the indicator closer to the 30 oversold level, a situation that could signal excessive bearish momentum and potentially create room for short-term bullish corrections in the sessions ahead.
Key Levels:
- 7,350 points – Key Resistance: This level coincides with important retracement areas observed in previous weeks and also aligns with the 200-period simple moving average. Price action managing to move back above this area could begin to challenge the recent weakness in SPX and potentially open the door to a more indecisive environment, even favoring the development of a trading range in the weeks ahead.
- 7,250 points – Nearby Barrier: This area aligns with the 38.2% Fibonacci retracement level and could become an important reference point in the event short-term bullish corrections begin to emerge.
- 7,090 points – Key Support: This level corresponds to lows not seen since April and May of this year and currently represents the most important downside barrier on the chart. Price action moving increasingly closer to this area could continue highlighting the dominance of the bearish bias. In addition, if selling pressure remains consistent around this level, a more aggressive bearish trendline could begin to gain relevance and potentially become the dominant technical structure over the coming weeks.
Written by Julian Pineda, CFA, CMT – Market Analyst
Follow him on: @julianpineda25



Open an account in minutes
Experience award-winning platforms with fast and secure execution, and enjoy tight spreads from 0.5 pts on FX and 0.3 pts on indices.
Economic calendar
Web Trader platform
Our sophisticated web-based platform is packed with features.
Related articles
S&P 500 Analysis: SPX Is Going Through One of Its Most Difficult Periods of 2026
Confidence around the U.S. equity market continues to face significant pressure. Over the last three trading sessions alone, the S&P 500 has fallen nearly 3.3%, highlighting a bearish bias that has become increasingly evident across the broader market.

Nasdaq 100 forecast: Markets turn jittery as Anthropic debuts at 34% above IPO
Nasdaq futures were up some 2% earlier, but shortly after the Anthropic debut, the index slumped to session lows, down more than 1.5%, before bouncing back from the lows at the time of writing. Much of the selling for the Nasdaq was driven by AMD which slumped nearly 10% after a Hunterbrook Media report raised fresh questions about the company’s exposure to US export controls on China.


Gold Analysis: Why Does XAU/USD Keep Losing Ground?
The past few trading sessions have not been particularly favorable for gold, with the precious metal extending a string of consistent losses. Over the last three trading sessions alone, gold has declined by nearly 4.0%, highlighting that the bearish bias remains firmly in place.
This report is intended for general circulation only. It should not be construed as a recommendation, or an offer (or solicitation of an offer) to buy or sell any financial products. The information provided does not take into account your specific investment objectives, financial situation or particular needs. Before you act on any recommendation that may be contained in this report, independent advice ought to be sought from a financial adviser regarding the suitability of the investment product, taking into account your specific investment objectives, financial situation or particular needs.
StoneX Financial Pte. Ltd., may distribute reports produced by its respective foreign entities or affiliates within the StoneX group of companies or third parties pursuant to an arrangement under Regulation 32C of the Financial Advisers Regulations. Where the report is distributed to a person in Singapore who is not an accredited investor, expert investor or an institutional investor (as defined in the Securities Futures Act), StoneX Financial Pte. Ltd. accepts legal responsibility to such persons for the contents of the report only to the extent required by law. Singapore recipients should contact StoneX Financial Pte. Ltd. at 6826 9988 for matters arising from, or in connection with the report.
In the case of all other recipients of this report, to the extent permitted by applicable laws and regulations neither StoneX Financial Pte. Ltd. nor its associated companies will be responsible or liable for any loss or damage incurred arising out of, or in connection with, any use of the information contained in this report and all such liability is hereby expressly disclaimed. No representation or warranty is made, express or implied, that the content of this report is complete or accurate.
StoneX Financial Pte. Ltd. is not under any obligation to update this report.
Trading CFDs carries a high level of risk that may not be suitable for some investors. Consider your investment objectives, level of experience, financial resources, risk appetite and other relevant circumstances carefully. The possibility exists that you could lose some or all of your investments, including your initial deposits. If in doubt, please seek independent expert advice. Visit www.forex.com/en-sg/terms-and-policies for the complete Risk Disclosure Statement.