



Nasdaq 100 forecast: Markets turn jittery as Anthropic debuts at 34% above IPO
Nasdaq futures were up some 2% earlier, but shortly after the Anthropic debut, the index slumped to session lows, down more than 1.5%, before bouncing back from the lows at the time of writing. Much of the selling for the Nasdaq was driven by AMD which slumped nearly 10% after a Hunterbrook Media report raised fresh questions about the company’s exposure to US export controls on China.
Share this:

Nasdaq futures were up some 2% earlier, but shortly after the Anthropic debut, the index slumped to session lows, down more than 1.5%, before bouncing back from the lows at the time of writing. Much of the selling for the Nasdaq was driven by AMD which slumped nearly 10% after a Hunterbrook Media report raised fresh questions about the company’s exposure to US export controls on China. Sentiment remains jittery after a troubling week for financial markets, with equities, gold, silver and Bitcoin all coming under significant selling pressure. We maintain a cautious Nasdaq 100 forecast for now.
All eyes on Anthropic as company starts trading at $111.50
Much of the focus today has been on the Anthropic IPO and the company officially began trading on the Nasdaq at $111.50 and surged to $115 per share shortly after. It was thus up +39% from its $83 IPO price, but the stock then started to drop shortly after, falling below $100 at the time of writing. The starting point took the company's market cap above $2 trillion, making it the 6th most valuable public company in the world.
Its sheer size is expected to put it on course for accelerated inclusion in several major indices, including the Nasdaq 100, as early as late November or December. That could generate substantial demand from passive funds tracking those benchmarks. The S&P 500, however, is likely to be a longer wait, given its eligibility requirements, including a sufficient period of public trading and sustained GAAP profitability.
US equities have weathered storm for now but choppy waters ahead
US equities have endured a difficult few sessions, yet their resilience remains striking when compared with the much steeper declines in Bitcoin, silver and several major Asian equity markets. That said, relative outperformance should not be confused with immunity to a broader correction. Despite today’s bounce, the Nasdaq 100 remains well below its October peak, while underlying vulnerabilities are becoming increasingly difficult to overlook.
There are several reasons why Wall Street has held up better than other markets. Unlike in 2022, when aggressive Federal Reserve tightening triggered a widespread repricing of risk, the US economy has remained relatively resilient. Corporate earnings have also provided a degree of protection, while the enormous investment flowing into AI infrastructure continues to support expectations for future growth.
Nvidia’s latest results have helped reinforce that narrative, easing concerns that the AI investment cycle might be approaching a turning point. But questions over the eventual returns on such substantial capital expenditure have not gone away. With valuations elevated, even modest disappointments in corporate guidance could prompt a more meaningful reassessment of the sector.
Monetary policy presents another potential headwind. Further evidence of persistent inflation could strengthen expectations of additional Fed tightening, pushing Treasury yields higher and making expensive equity valuations harder to justify.
For now, economic resilience, earnings growth and the AI investment boom are providing Wall Street with important support. Anthropic’s debut may offer a fresh catalyst for technology shares, but it does little to resolve the broader questions surrounding valuations and the sustainability of AI-related spending. The risk of a deeper correction should not be dismissed.
Nasdaq 100 forecast: technical analysis and levels to watch
Markets have been particularly choppy of late, and several major indices have already broken through important technical levels. The Nasdaq 100, for instance, has moved below its 200-day moving average recently, as you can see on the chart.
On the upside, key resistance comes in between 27,750 and 28,200. This is an important technical area where several previous support and resistance levels converge, alongside the 200-day moving average and a short-term bearish trend line.
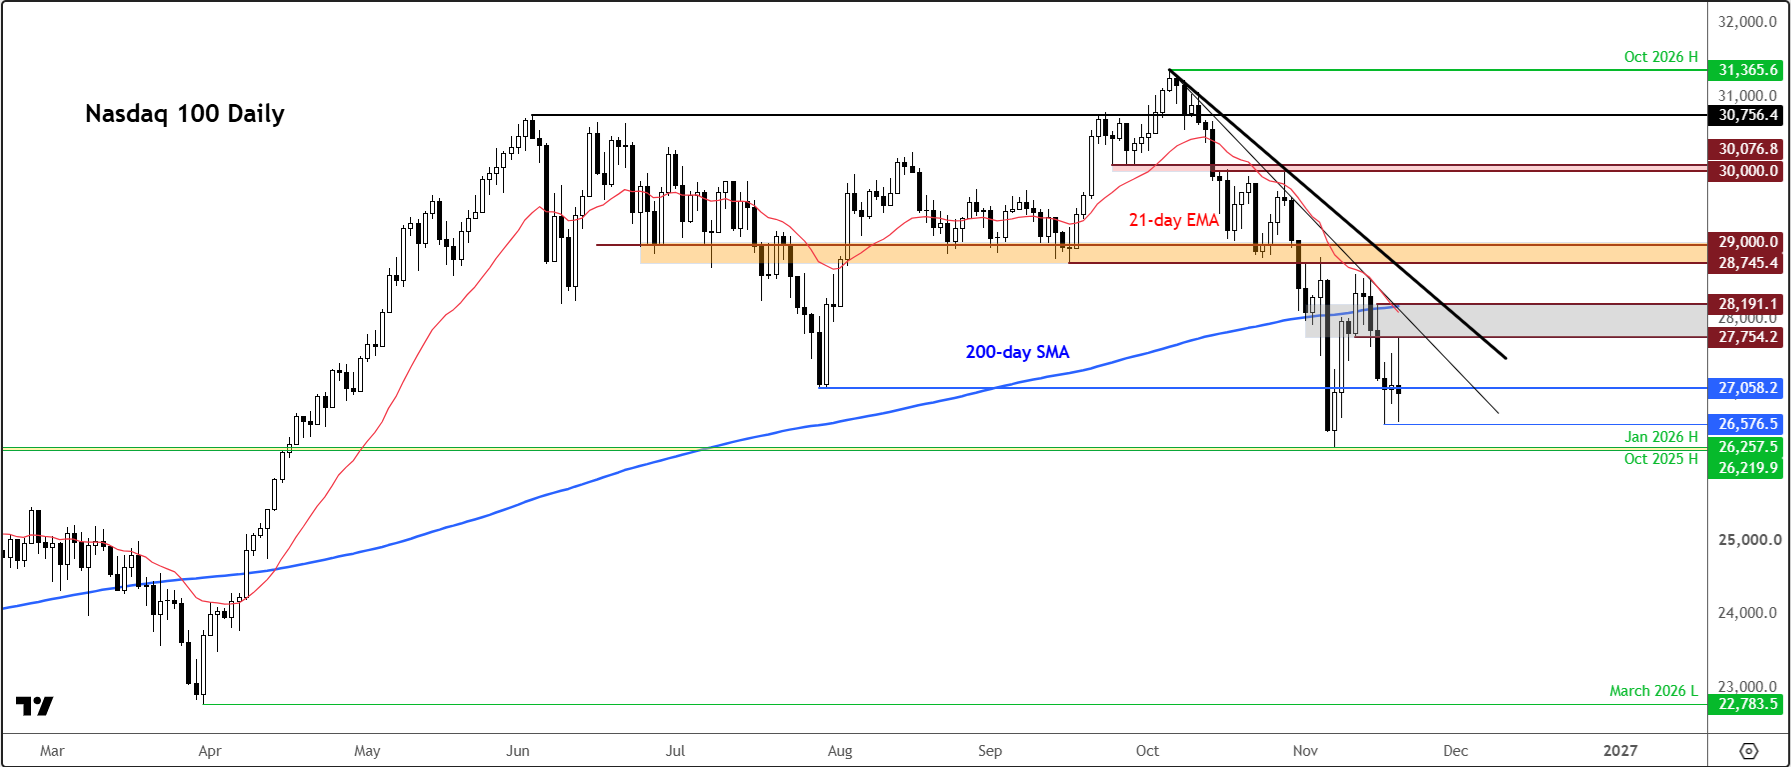
A decisive move back above this zone would be an encouraging bullish signal, potentially opening the door to further technical buying towards the 28,745 to 29,000 support-turned-resistance area. That is the next significant resistance zone, and a break above it would considerably improve the technical outlook.
On the downside, we have 27,058 level to keep an eye on. This is particularly important as it marks the late-July low, which was temporarily breached on a couple of occasions in early November and again earlier this week before the index recovered.
If the Nasdaq falls back below 27,058 and starts holding beneath that level, the technical picture would deteriorate considerably, increasing the risk of another leg lower.
Further down, the next major support zone comes in between 26,200 and 26,260, marking previous highs from late last year and early this year. This zone was tested earlier this month, providing a solid bounce.
Could the market bottom soon?
Potentially, but I wouldn’t jump on the bullish bandwagon just yet. We need to see evidence of a bullish reversal before becoming confident that a sustainable bottom is in place. Until then, I would treat this as a level-to-level market, with the next few sessions potentially providing more clarity.

Related tags:


Open an account in minutes
Experience award-winning platforms with fast and secure execution, and enjoy tight spreads from 0.5 pts on FX and 0.3 pts on indices.
Economic calendar
Web Trader platform
Our sophisticated web-based platform is packed with features.
Related articles
Nasdaq 100, SOX: Tech rout may be a symptom of something far larger
The financial tide is going out, and some of the market's biggest winners are being hammered. Our research suggests there's more to the tech rout than the AI headlines.

S&P 500 Analysis: SPX Is Going Through One of Its Most Difficult Periods of 2026
Confidence around the U.S. equity market continues to face significant pressure. Over the last three trading sessions alone, the S&P 500 has fallen nearly 3.3%, highlighting a bearish bias that has become increasingly evident across the broader market.


British Pound Short-term Outlook: GBP/USD 3% Plunge Hits 12-Month Low—Key Support in Focus 11 19 2026
Sterling’s October rebound has unraveled, leaving GBP/USD bears in control—but stretched momentum raises the stakes for the weekly close

This report is intended for general circulation only. It should not be construed as a recommendation, or an offer (or solicitation of an offer) to buy or sell any financial products. The information provided does not take into account your specific investment objectives, financial situation or particular needs. Before you act on any recommendation that may be contained in this report, independent advice ought to be sought from a financial adviser regarding the suitability of the investment product, taking into account your specific investment objectives, financial situation or particular needs.
StoneX Financial Pte. Ltd., may distribute reports produced by its respective foreign entities or affiliates within the StoneX group of companies or third parties pursuant to an arrangement under Regulation 32C of the Financial Advisers Regulations. Where the report is distributed to a person in Singapore who is not an accredited investor, expert investor or an institutional investor (as defined in the Securities Futures Act), StoneX Financial Pte. Ltd. accepts legal responsibility to such persons for the contents of the report only to the extent required by law. Singapore recipients should contact StoneX Financial Pte. Ltd. at 6826 9988 for matters arising from, or in connection with the report.
In the case of all other recipients of this report, to the extent permitted by applicable laws and regulations neither StoneX Financial Pte. Ltd. nor its associated companies will be responsible or liable for any loss or damage incurred arising out of, or in connection with, any use of the information contained in this report and all such liability is hereby expressly disclaimed. No representation or warranty is made, express or implied, that the content of this report is complete or accurate.
StoneX Financial Pte. Ltd. is not under any obligation to update this report.
Trading CFDs carries a high level of risk that may not be suitable for some investors. Consider your investment objectives, level of experience, financial resources, risk appetite and other relevant circumstances carefully. The possibility exists that you could lose some or all of your investments, including your initial deposits. If in doubt, please seek independent expert advice. Visit www.forex.com/en-sg/terms-and-policies for the complete Risk Disclosure Statement.