


Gold and Silver's Deepening Dollar Dilemma
The dollar has broken higher, gold and silver have been crushed, and US financial conditions are tightening rapidly. Our historical analysis suggests this is no ordinary precious metals selloff.
Share this:
- US financial conditions tighten at exceptional pace
- Gold and silver suffer historically severe selloffs
- Dollar sensitivity approaches multi-decade historical extremes
- Bearish technicals suggest further downside remains possible
Gold and silver were smashed again on Thursday as risk appetite reversed sharply alongside Anthropic's blockbuster IPO. While the company's shares finished comfortably above their offer price, the broader tech sector slumped as concerns about the eventual returns from the AI capex boom continued to weigh on sentiment.
But what if the pressure we're seeing in tech is only part of a much broader problem? Our US financial conditions proxy points to a rapid tightening that may help explain why volatility is spreading across asset classes, including precious metals. And as our updated historical analysis reveals, what's happening in gold and silver right now is extraordinary, even when compared with previous periods of severe market stress.
US financial conditions tightening accelerates
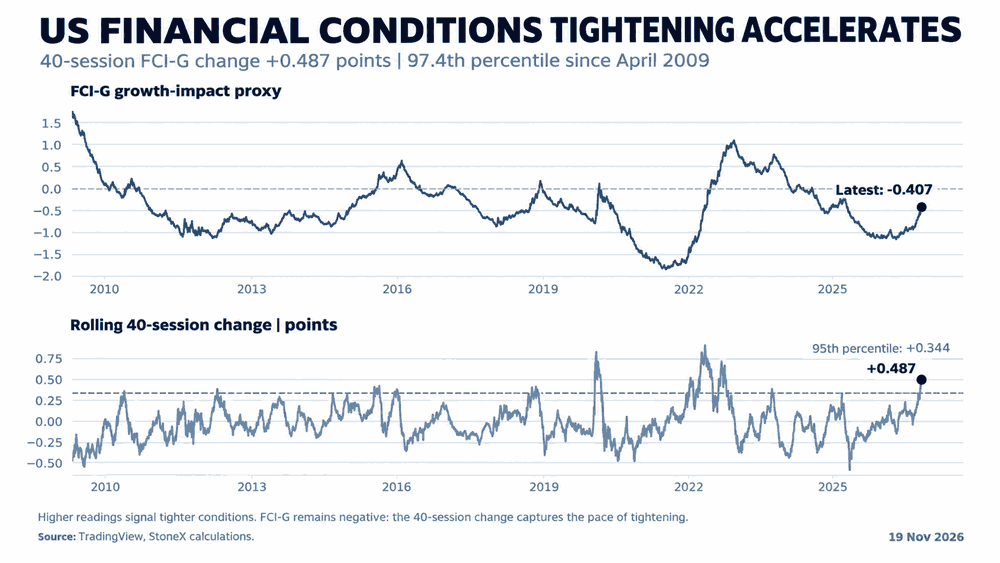
Our model, which aims to replicate the Fed's Financial Conditions Impulse on Growth (FCI-G), is shown below. For those unfamiliar with it, the measure combines seven financial market variables to assess whether conditions are supportive or restrictive for economic activity, with obvious implications for the performance of different asset classes.
Source: LSEG, TradingView
While our model suggests financial conditions remain accommodative, what can't be ignored is the speed at which that accommodation is being withdrawn. Over the past 40 trading sessions, the measure has risen 0.487 points, a pace of tightening exceeded in just 2.6% of comparable periods since April 2009.
To put this into perspective, moves of this magnitude have typically occurred during periods of severe market stress, such as the onset of the coronavirus pandemic in early 2020 and the Liberation Day tariff announcement in April 2025.
Gold and silver crushed as financial conditions tighten
Source: LSEG, TradingView
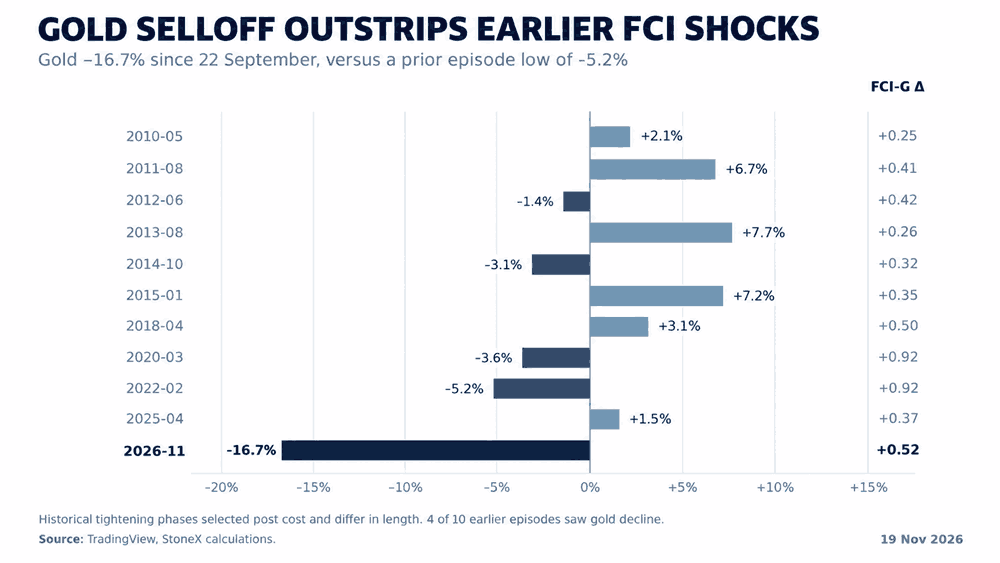
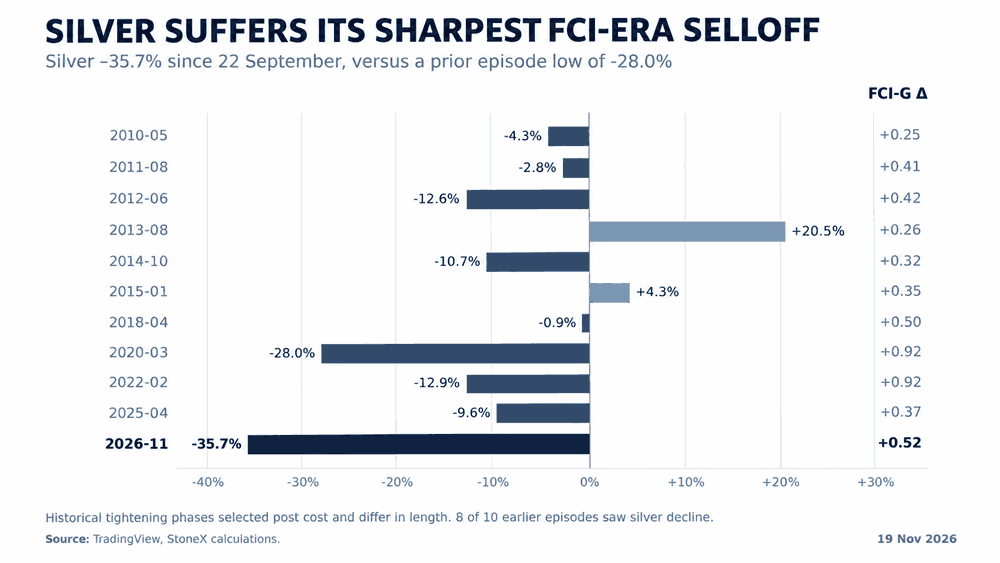
The impact on precious metals from the unwind of accommodation shown in our model has been simply brutal. Since 22 September, gold has tanked 16.7%, while silver has plunged by more than double, sliding 35.7%. Both declines are larger than those witnessed during any of the 10 previous episodes of rapid tightening identified since 2009.
Not only has the scale of these declines been unprecedented across the episodes studied, but it's also notable that gold's safe-haven characteristics appear to have shifted. Gold actually rose during six prior rapid tightening episodes, whereas more recently, the exact opposite has taken place. The only exception was the Liberation Day tariff announcement in April 2025, when the US dollar was broadly weaker amid the temporary 'sell USA' trade.
Source: LSEG, TradingView
Declines in silver are far more common during these episodes, likely reflecting not only its highly speculative characteristics but also its links to the industrial side of the global economy.
Dollar breakout compounds pressure on precious metals
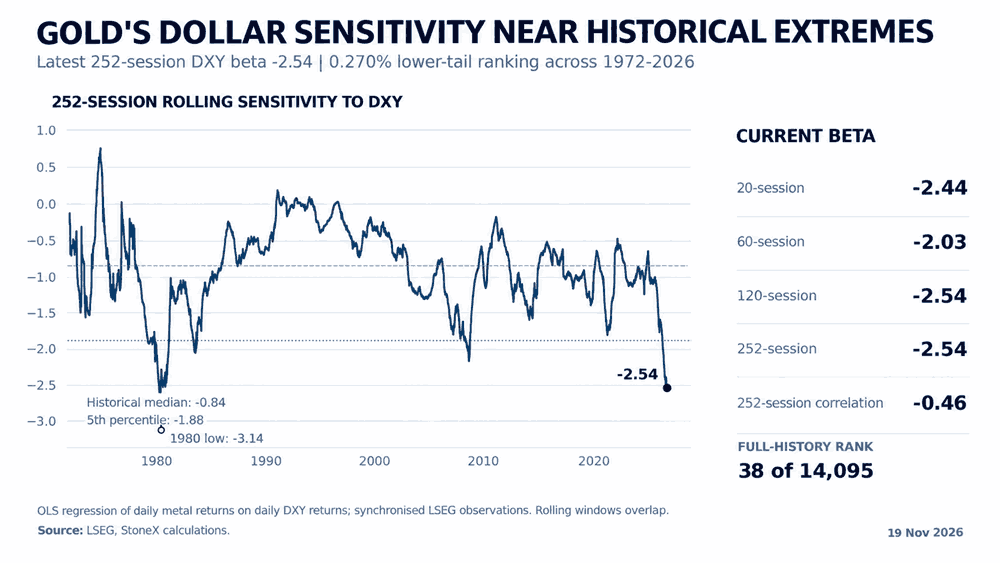
As discussed in a short analysis piece earlier this week, the US dollar staged a dramatic bullish breakout earlier this month, hitting levels not seen since April 2025. That move is especially problematic for gold and silver given just how sensitive both metals have become to movements in the big dollar over the past year.
Source: LSEG, TradingView
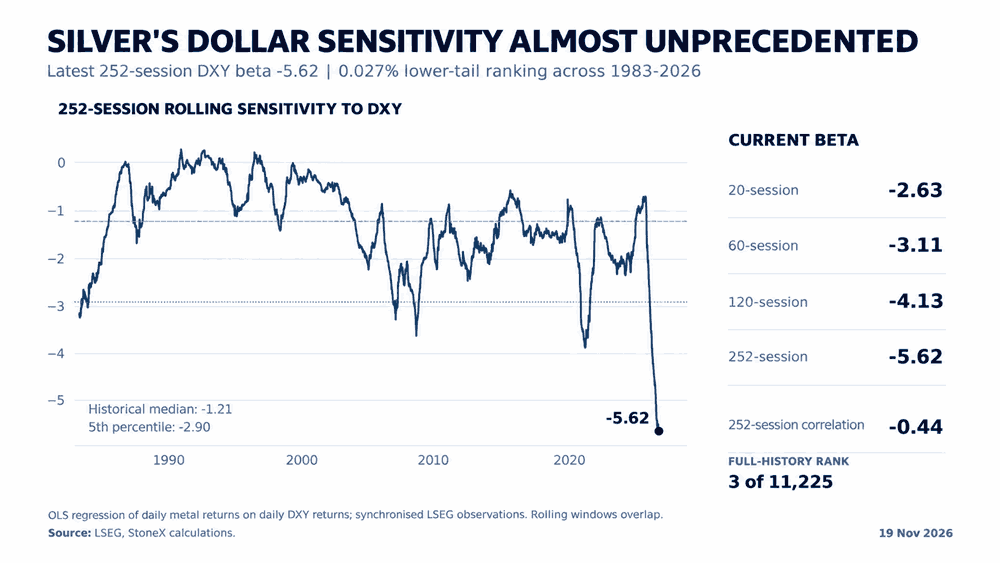
Using daily data going back more than five decades, gold's 252-session beta to DXY of −2.54 is the 38th most negative observation since 1972, exceeded only during the precious metals turmoil in 1980 and briefly earlier this week. For silver, the reading is even more extreme. Its beta of −5.62 is the third most negative since 1983, with the only two more extreme readings occurring earlier this month.
Source: LSEG, TradingView
To put those figures into perspective, a 1% rise in DXY has been associated with a roughly 2.54% decline in gold and a 5.62% fall in silver over the past 252 trading sessions. The reverse applies when the dollar weakens. Of course, these are historical statistical relationships and can change over time. But the current readings highlight just how sensitive both silver and gold have become to shifts in the dollar over the past year.
As discussed previously, while DXY may be due a period of consolidation after such a strong run, from a fundamental perspective, unless the Fed backs away from its hawkish stance or US economic data starts to roll over, it's difficult to make the near-term case for a sustained dollar reversal. An outcome that could leave precious metals stuck in the pressure cooker for a while longer.
This content was created by an affiliate of FOREX.com and represents the views and opinions of the author/speakers, not the views and opinions of FOREX.com, StoneX Group Inc., or its subsidiaries. The content has not been independently reviewed by FOREX.com.
Gold slide turns violent
Source: TradingView
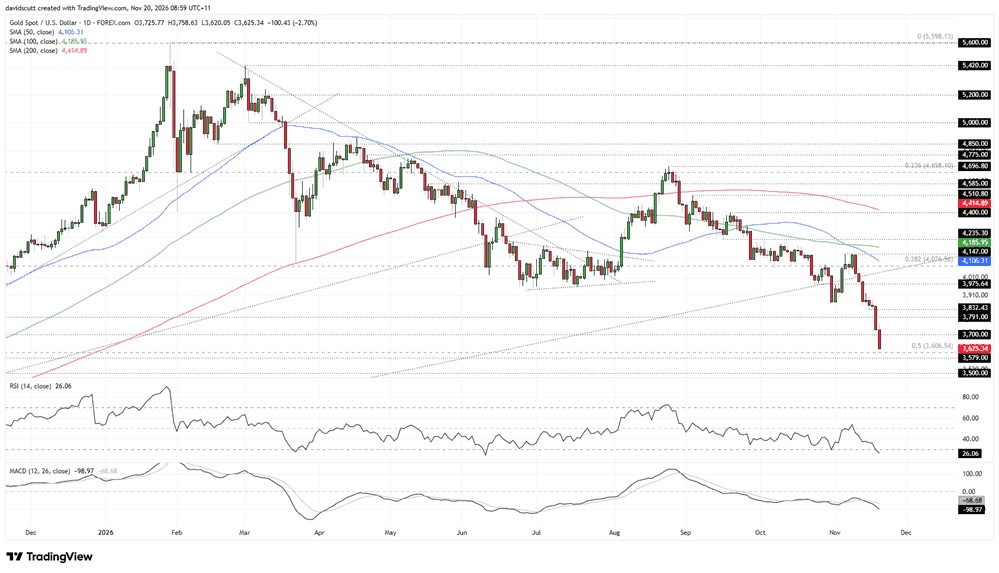
After repeatedly attracting buyers beneath $4,000 in June and July, and again in October, gold's inability to hold above that level, let alone challenge its medium and long-term moving averages, has given way to an abrupt unwind as financial conditions tighten.
Since 10 November, the price action has been outright ugly. Gold has plunged more than $500, falling from $4,147 to around $3,625, slicing through the late-October lows near $3,870 before motoring through a series of minor support levels.
Looking at the bigger picture, the next level of note is the 50% retracement of the massive bull run from September 2022 to January 2026, which saw gold surge from around $1,615 to $5,600. That retracement sits near $3,607, just beneath where the price currently trades. While gold hasn't shown much respect for retracement levels previously, it's one to monitor given the scale of the move.
Below that, $3,579 is another minor level of note, followed by the former record high of $3,500 set in April 2025. Gold spent six months struggling to overcome that level before eventually staging a massive bullish breakout.
Nothing is a certainty in markets, but given the current trajectory, the price appears to be on a collision course with $3,500. The momentum indicators are certainly on board with that view. RSI (14) has printed a fresh lower low near 26, suggesting downside momentum continues to build, while MACD has staged a bearish crossover, diverging further from its signal line and confirming the bearish message.
Yes, the move is stretched and prone to a short-term squeeze, as witnessed intraday on Thursday. But right now, the path of least resistance still looks lower. With US financial conditions tightening rapidly, the abrupt nature of this unwind reeks of a shortage of US dollar liquidity, potentially explaining why the selling has become so violent.
Silver smoked
Source: TradingView
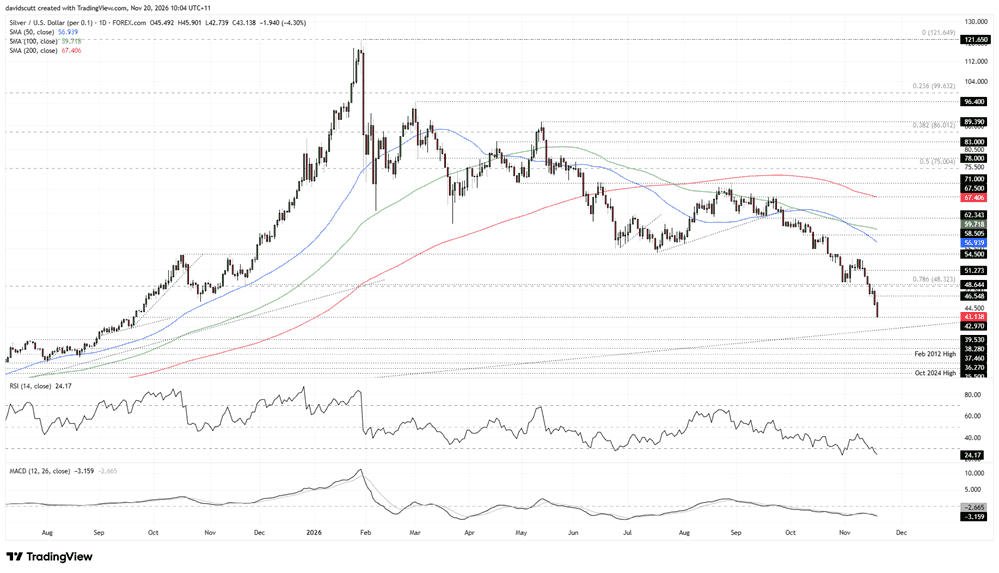
The unwind in silver has been even more extreme than gold, with the price now in a strong bear market, trading well below its key medium and long-term moving averages and keeling over like a ship going under.
After failing to reclaim $54.50 earlier this month, the selling pressure has been relentless. Former support at $48.65 and the nearby 78.6% Fib of the April 2025 to January 2026 bull run at $48.32 have both given way, triggering another accelerated move lower.
That has brought the price back towards $42.97, a former resistance level that acted as a breakout zone during the bull run in the second half of 2025. Just beneath $41, a rising trend line extending from the February 2024 lows is another level of note, although it has yet to register the three touches needed to establish it as more reliable trend support. Below that, $39.53 is another former breakout level to watch.
Like the price action, the oscillators remain firmly bearish, although there's one minor development worth watching. Despite the latest unwind, RSI (14) has not printed a fresh lower low relative to October. That suggests downside momentum may not be building with quite the same intensity, although it's certainly not a signal to act upon at this stage. RSI may yet make a fresh low, but it hasn't been confirmed.
MACD continues to deliver a bearish message, having staged another crossover in negative territory and now diverging further beneath its signal line. The bearish bias remains very much intact.
As with gold, the move is stretched and vulnerable to sudden short squeezes. Should we see a rebound, $46.55 is the first level of note, followed by the 78.6% Fib at $48.32 and former support at $48.65. Until the price can reclaim these levels, the bears remain firmly in control.


Open an account in minutes
Experience award-winning platforms with fast and secure execution, and enjoy tight spreads from 0.5 pts on FX and 0.3 pts on indices.
Economic calendar
Web Trader platform
Our sophisticated web-based platform is packed with features.
Related articles
Nasdaq 100, SOX: Tech rout may be a symptom of something far larger
The financial tide is going out, and some of the market's biggest winners are being hammered. Our research suggests there's more to the tech rout than the AI headlines.

Gold and Silver's Deepening Dollar Dilemma
The dollar has broken higher, gold and silver have been crushed, and US financial conditions are tightening rapidly. Our historical analysis suggests this is no ordinary precious metals selloff.

British Pound Short-term Outlook: GBP/USD 3% Plunge Hits 12-Month Low—Key Support in Focus 11 19 2026
Sterling’s October rebound has unraveled, leaving GBP/USD bears in control—but stretched momentum raises the stakes for the weekly close

This report is intended for general circulation only. It should not be construed as a recommendation, or an offer (or solicitation of an offer) to buy or sell any financial products. The information provided does not take into account your specific investment objectives, financial situation or particular needs. Before you act on any recommendation that may be contained in this report, independent advice ought to be sought from a financial adviser regarding the suitability of the investment product, taking into account your specific investment objectives, financial situation or particular needs.
StoneX Financial Pte. Ltd., may distribute reports produced by its respective foreign entities or affiliates within the StoneX group of companies or third parties pursuant to an arrangement under Regulation 32C of the Financial Advisers Regulations. Where the report is distributed to a person in Singapore who is not an accredited investor, expert investor or an institutional investor (as defined in the Securities Futures Act), StoneX Financial Pte. Ltd. accepts legal responsibility to such persons for the contents of the report only to the extent required by law. Singapore recipients should contact StoneX Financial Pte. Ltd. at 6826 9988 for matters arising from, or in connection with the report.
In the case of all other recipients of this report, to the extent permitted by applicable laws and regulations neither StoneX Financial Pte. Ltd. nor its associated companies will be responsible or liable for any loss or damage incurred arising out of, or in connection with, any use of the information contained in this report and all such liability is hereby expressly disclaimed. No representation or warranty is made, express or implied, that the content of this report is complete or accurate.
StoneX Financial Pte. Ltd. is not under any obligation to update this report.
Trading CFDs carries a high level of risk that may not be suitable for some investors. Consider your investment objectives, level of experience, financial resources, risk appetite and other relevant circumstances carefully. The possibility exists that you could lose some or all of your investments, including your initial deposits. If in doubt, please seek independent expert advice. Visit www.forex.com/en-sg/terms-and-policies for the complete Risk Disclosure Statement.