


Nasdaq 100, SOX: Tech rout may be a symptom of something far larger
The financial tide is going out, and some of the market's biggest winners are being hammered. Our research suggests there's more to the tech rout than the AI headlines.
Share this:

- US financial conditions tightening at exceptional speed
- Non-equity tightening among largest episodes since 2009
- SOX fell in all 10 previous episodes, Nasdaq nine
- Nasdaq 100, SOX technicals favour bearish bias
What if the sell-off in technology stocks isn't really about Jensen Huang? Or Anthropic's record IPO and the selling elsewhere to fund it? What if it's not about portfolio rebalancing, stretched valuations or growing concerns about the returns investors will ultimately see from the enormous sums being ploughed into the AI capex buildout?
What if the explanation is simpler? What if the metaphorical market tide is simply going out?
What we're witnessing in the United States is financial conditions tightening at one of the fastest rates in recent history. After a prolonged period of highly accommodative conditions that helped propel asset prices higher, the withdrawal of that support may now be taking its toll, including on technology stocks.
The tide is going out
Our US financial conditions index proxy is based on the Federal Reserve's FCI-G model, which is designed to estimate the impact of financial conditions on economic growth. Even after the recent tightening, the model suggests conditions remain relatively accommodative.
But for markets, it's not necessarily the level of accommodation or restrictiveness that matters most. It's the speed at which conditions change that seems far more important, especially following a prolonged period of strength or weakness in asset prices.
Source: TradingView
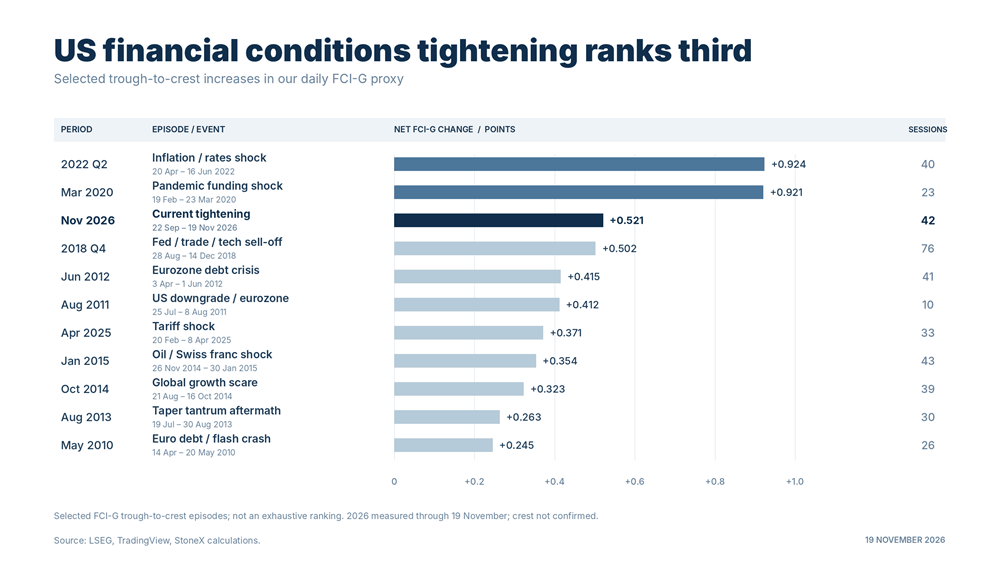
And that's where the current unwind stands out. Since late September, our model has recorded a 0.521-point tightening in financial conditions, a move that ranks around the 98th percentile of comparable changes in our dataset, which extends back to 2009. Of the 11 major tightening episodes identified over that period, only two have been larger than the one currently underway.
In other words, we're witnessing one of the fastest withdrawals of financial accommodation in more than 15 years, even though overall conditions remain supportive of growth in absolute terms.
Given the tightening in conditions we've seen and the strength in the US dollar accompanying it, anyone who's been around markets for a while would get the sense that dollar liquidity may be drying up. But so far, we've looked at repo spreads and demand for emergency liquidity from the Fed, and there's no evidence of any acute stress. It doesn't mean there aren't pockets of stress in the system, but it's not in plain sight right now.
It's not just equities driving the tightening
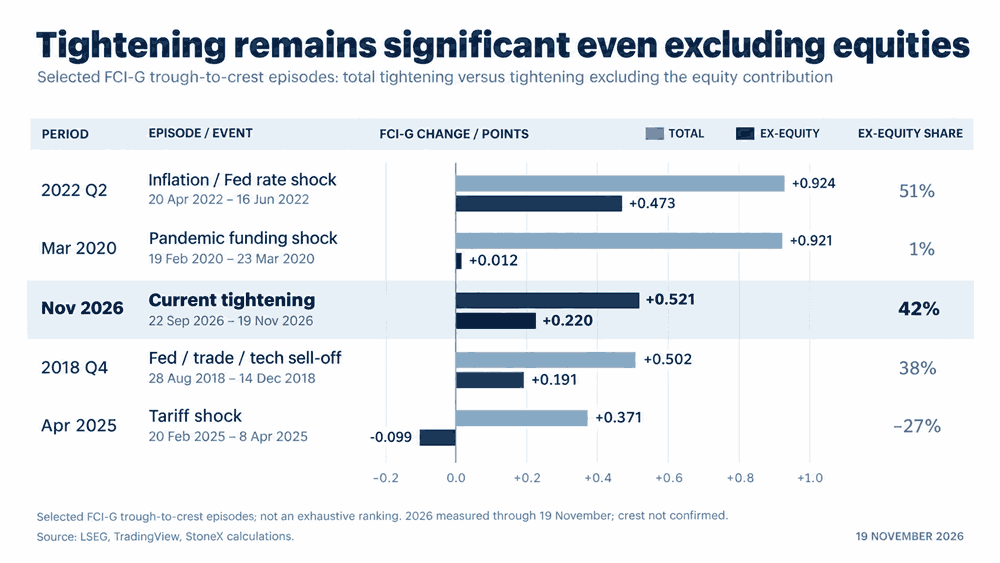
Of course, anyone familiar with the Fed model will know that equities are one of its inputs and can therefore influence the overall reading. But what happens when we strip them out?
Source: TradingView
Excluding equities, conditions have tightened by 0.220 points over the same period, the second-largest increase among the 11 episodes identified above. Only the inflation and interest rate shock of 2022 produced a larger move. That's a significant departure from the episodes of early 2020 and Liberation Day in 2025, when equities were the primary driver of tighter conditions.
Now, we're not for one moment suggesting this will happen. But if selling pressure broadens across equity markets, with conditions already having tightened substantially elsewhere, the overall impact could become considerably larger than what we've witnessed so far.
Semis bear the brunt
What's notable about the current tightening in conditions is that the markets that led the rally in riskier assets during the previous period of accommodation are now among those under the most pressure. Look at gold, silver and the Philadelphia Semiconductor Index (SOX).
Source: TradingView
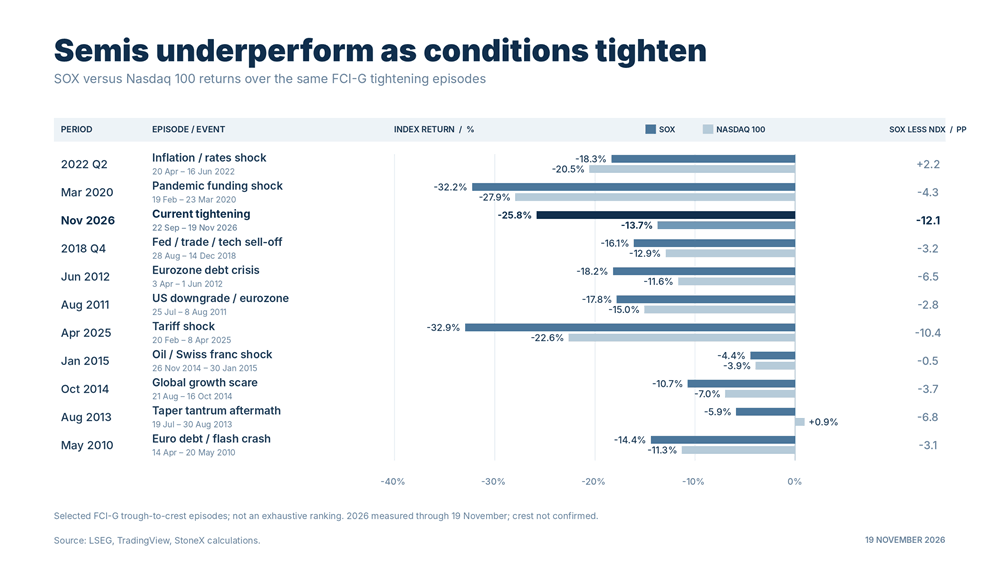
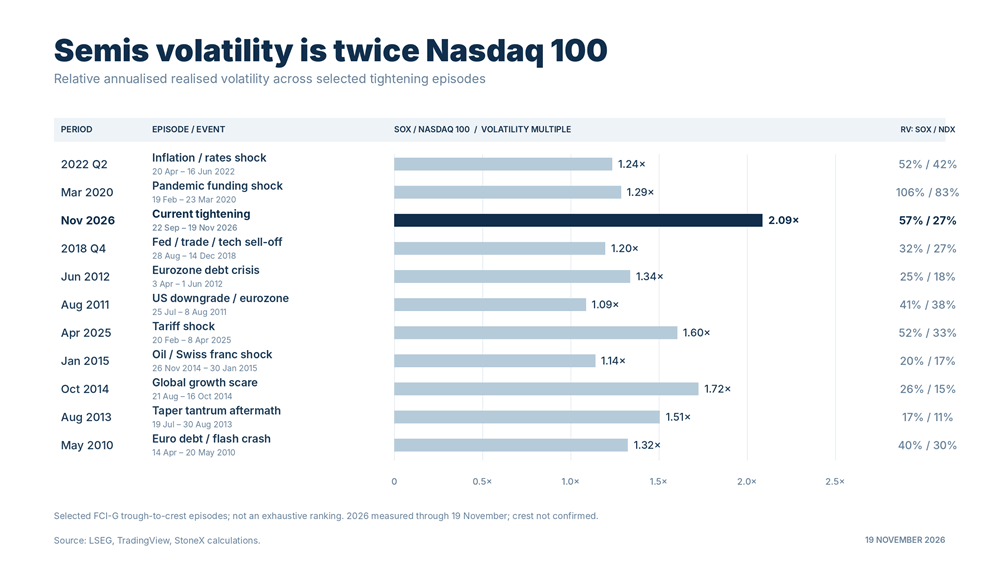
The latter has fallen 25.8% since late September, nearly double the 13.7% decline in the Nasdaq 100. Realised vol in the SOX has also been more than double that of the Nasdaq. Again, a historically rare outcome. The more telling statistic is that the SOX fell during all 10 previous comparable tightening episodes, while the Nasdaq 100 declined in nine.
Source: TradingView
And given the Nasdaq 100 is heavily weighted towards the hyperscalers, the degree of underperformance and increased volatility add to the argument that tighter conditions are playing a more substantive role in the rout than they're being given credit for.
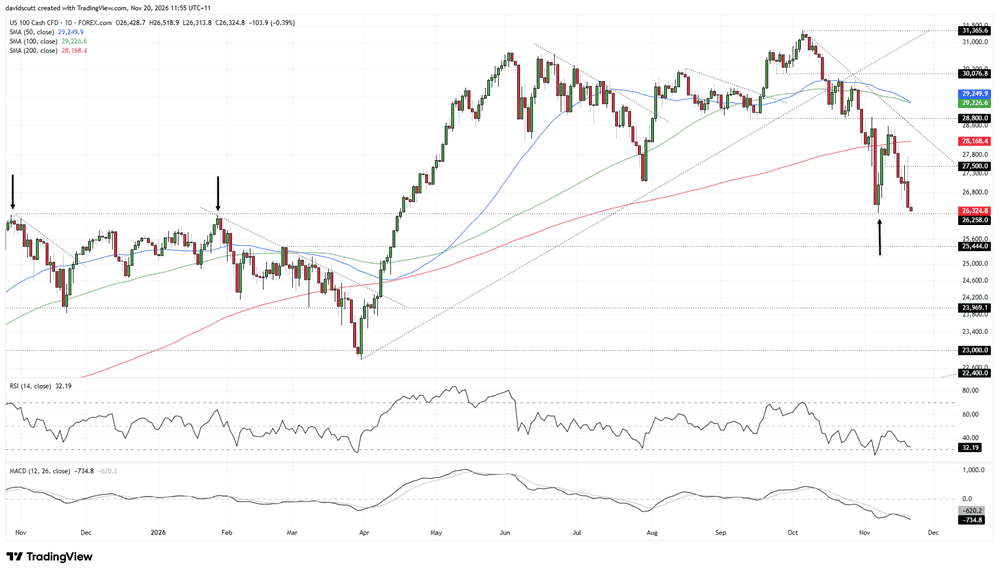
Nasdaq 100: 26,258 looms
Source: TradingView
Our Nasdaq 100 contract now finds itself teetering above 26,258, a level that has repeatedly acted as support and resistance, including as a major breakout point during the rapid rebound seen in April this year.
With the price firmly entrenched in a downtrend and beneath all its major medium and long-term moving averages, including the 50 and 100-day moving averages that are now sloping lower, there's a growing risk that this level could soon give way.
RSI (14) remains well below the neutral 50 level, suggesting downside momentum is building again. MACD reinforces that message, diverging further from its signal line deep in negative territory. The one minor concern for bears is that RSI (14) has yet to establish a fresh lower low. It doesn't mean it won't, but it's something to monitor as the price tests this important level. Despite that caveat, a bearish bias remains preferred, particularly on rallies.
Should 26,258 break sustainably, 25,444 is the next level to watch, having acted as resistance in March before being breached during April's dramatic rebound. Below that, 23,969 is a more prominent level, having repeatedly acted as support and resistance earlier this year, with bulls frequently fighting to reclaim it during March and April. Further down, 23,000 marks support established in August 2025 that held when tested again in March.
On the upside, should 26,258 hold, 27,500 is the first level of note. While not the cleanest technically, the price has repeatedly probed this area in recent weeks, including a sharp reversal after briefly trading above it early in Thursday's session. Beyond that, the 200-day moving average, downtrend resistance from October's record high and 28,800 are the next levels to watch.
SOX bears remain in control
Source: TradingView
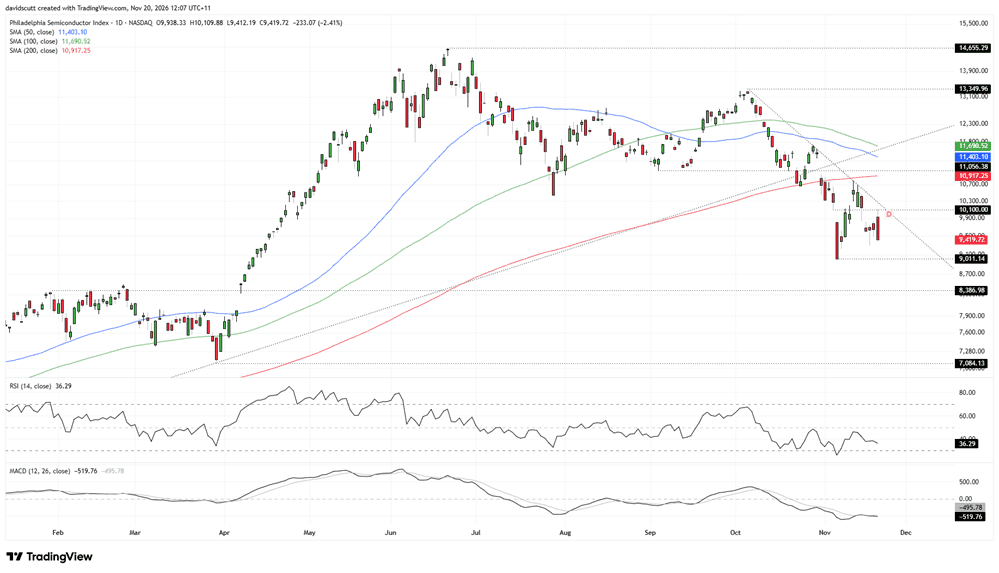
The technical picture for the SOX looks much the same as for our Nasdaq 100 contract, although it's notable that the rebound seen during the third quarter never managed to reclaim the high set in June.
The price remains firmly entrenched in a downtrend, trading beneath all its major medium and long-term moving averages. Downside momentum is building again, although RSI (14) has yet to break beneath the low set earlier this month.
That puts 9,011.1, the low from earlier this month, firmly in focus. A sustained break would expose 8,387, a former resistance level that was breached in April before holding on a subsequent retest. If the sell-off becomes more severe, 7,084.1, the low set in March, is another level to watch.
On the upside, 10,100 has repeatedly acted as support and resistance in recent weeks. Downtrend resistance from the October highs is located just above, around 10,300, followed by the 200-day moving average at 10,917.
A bearish bias remains preferred, although the price is currently trading around the middle of its recent range.


Open an account in minutes
Experience award-winning platforms with fast and secure execution, and enjoy tight spreads from 0.5 pts on FX and 0.3 pts on indices.
Economic calendar
Web Trader platform
Our sophisticated web-based platform is packed with features.
Related articles
Nasdaq 100, SOX: Tech rout may be a symptom of something far larger
The financial tide is going out, and some of the market's biggest winners are being hammered. Our research suggests there's more to the tech rout than the AI headlines.

Gold and Silver's Deepening Dollar Dilemma
The dollar has broken higher, gold and silver have been crushed, and US financial conditions are tightening rapidly. Our historical analysis suggests this is no ordinary precious metals selloff.

British Pound Short-term Outlook: GBP/USD 3% Plunge Hits 12-Month Low—Key Support in Focus 11 19 2026
Sterling’s October rebound has unraveled, leaving GBP/USD bears in control—but stretched momentum raises the stakes for the weekly close

This report is intended for general circulation only. It should not be construed as a recommendation, or an offer (or solicitation of an offer) to buy or sell any financial products. The information provided does not take into account your specific investment objectives, financial situation or particular needs. Before you act on any recommendation that may be contained in this report, independent advice ought to be sought from a financial adviser regarding the suitability of the investment product, taking into account your specific investment objectives, financial situation or particular needs.
StoneX Financial Pte. Ltd., may distribute reports produced by its respective foreign entities or affiliates within the StoneX group of companies or third parties pursuant to an arrangement under Regulation 32C of the Financial Advisers Regulations. Where the report is distributed to a person in Singapore who is not an accredited investor, expert investor or an institutional investor (as defined in the Securities Futures Act), StoneX Financial Pte. Ltd. accepts legal responsibility to such persons for the contents of the report only to the extent required by law. Singapore recipients should contact StoneX Financial Pte. Ltd. at 6826 9988 for matters arising from, or in connection with the report.
In the case of all other recipients of this report, to the extent permitted by applicable laws and regulations neither StoneX Financial Pte. Ltd. nor its associated companies will be responsible or liable for any loss or damage incurred arising out of, or in connection with, any use of the information contained in this report and all such liability is hereby expressly disclaimed. No representation or warranty is made, express or implied, that the content of this report is complete or accurate.
StoneX Financial Pte. Ltd. is not under any obligation to update this report.
Trading CFDs carries a high level of risk that may not be suitable for some investors. Consider your investment objectives, level of experience, financial resources, risk appetite and other relevant circumstances carefully. The possibility exists that you could lose some or all of your investments, including your initial deposits. If in doubt, please seek independent expert advice. Visit www.forex.com/en-sg/terms-and-policies for the complete Risk Disclosure Statement.