





S&P 500 and Dow Jones Mixed as ASX 200 Eyes Near-Term Downside
Wall Street futures remain choppy despite fresh highs, while ASX 200 slips towards support as bulls prepare for a potential swing low.
Share this:

S&P 500 and Nasdaq 100 futures reached new record highs on Monday, although trading conditions remain choppy and both indices gave back much of their early-week gains. Wall Street futures gapped higher at the open following news of a US-EU trade deal, but sentiment around the agreement is mixed. France criticised the 15% tariffs as a “submission,” while other member states view the deal as better than no deal—albeit far from ideal.
View related analysis:
View related analysis:
Wall Street Futures Mixed After Highs, ASX 200 Nearing Key Support
- S&P 500 futures are holding above 6400, though a 2-bar bearish reversal pattern (dark cloud cover) has formed on the daily chart.
- Nasdaq 100 futures printed a small shooting star candle, and with prices extended above the 10-day EMA, a minor pullback could be due.
- Dow Jones futures are struggling to gain traction above the July high and show the potential to dip back below 45,000 in the near term. Bearish divergence has also formed on the daily RSI (14).
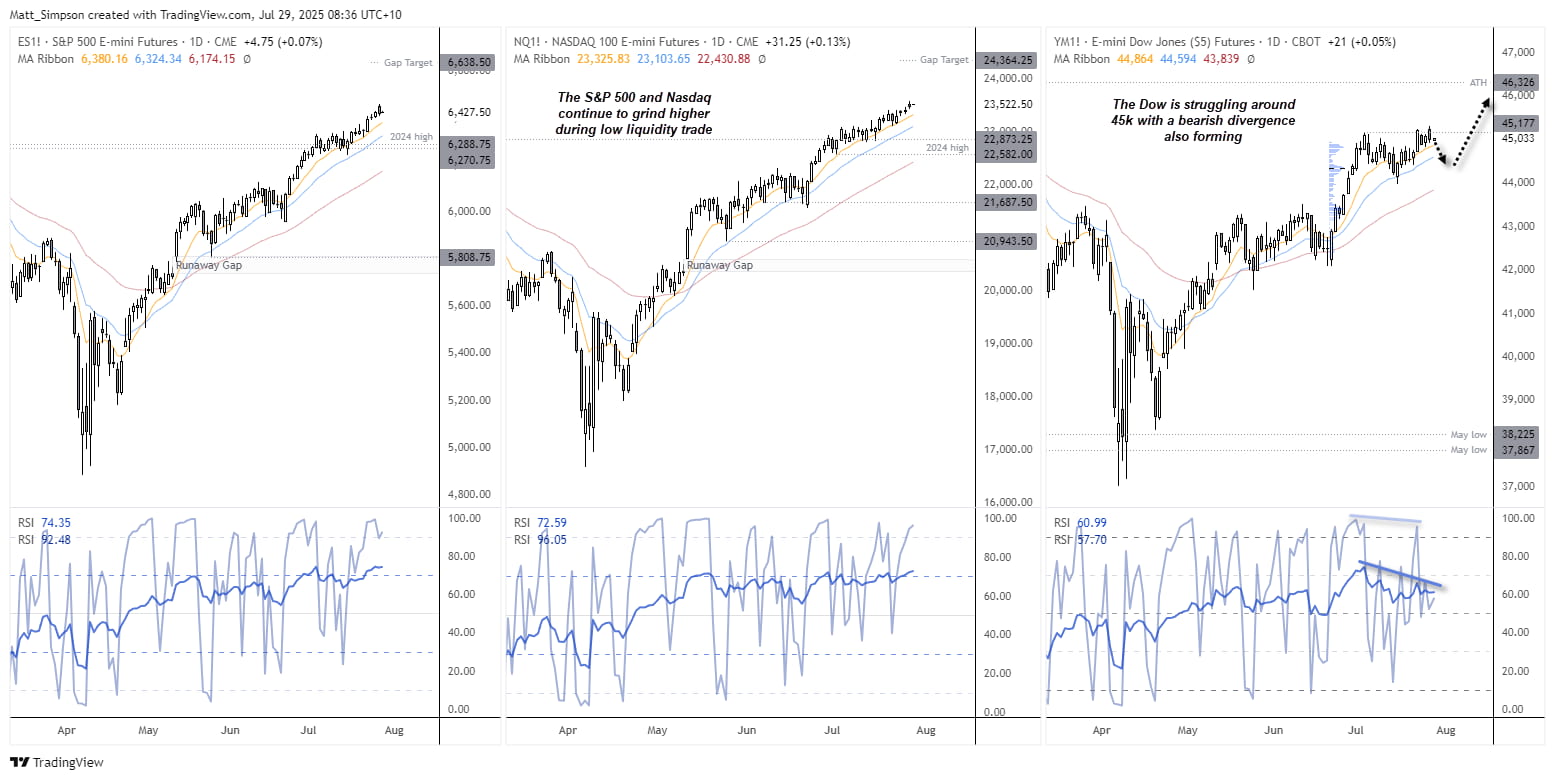
Chart analysis by Matt Simpson, Source: TradingView, CME Futures, S&P 500 E-mini Futures, NASDAQ 100 E-mini Futures, Dow Jones E-mini Futures
ASX 200 Futures (SPI 200) Technical Analysis
Last week I outlined my bias for the ASX 200 to retreat lower before continuing its move towards 9,000. Prices have indeed been grinding lower and may well move towards the high-volume node (HVN) at 8,537 before a low is found. For now, the ASX 200 is holding above the December high, so we should also be on guard for a swing low to form soon, given its bullish trend structure on the daily chart.
A double bottom has formed on the 1-hour chart around the December high, leaving the potential for a bounce in todays session. Though Monday’s relatively long, bearish inside day suggest bears remain in control and a move towards the HVN (8535) remain on the cards. At which point, ASX bulls could reconsider its potential for a swing low to form on the daily chart.
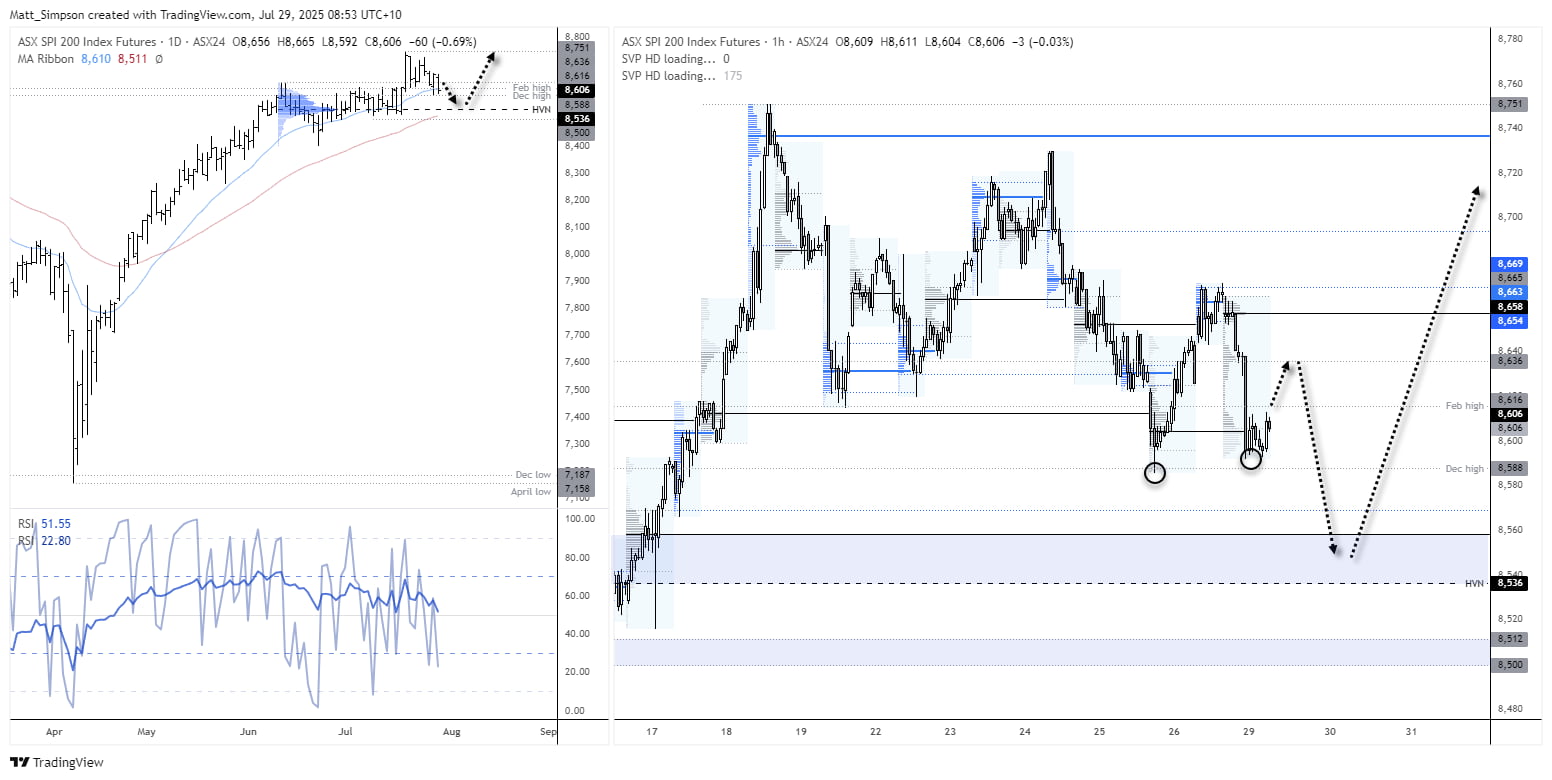
Chart analysis by Matt Simpson - Source: TradingView, ASX SPI 200 Index Futures, S&P/ASX 200 Index
Key Economic Events for Traders (AEST / GMT+10)
13:35 JPY 2-Year JGB Auction (USD/JPY, EUR/JPY, AUD/JPY, Nikkei 225)
16:00 SEK GDP (Jun/Q2) (EUR/SEK, USD/SEK, GBP/SEK)
16:00 NOK Core Retail Sales (Jun) (EUR/NOK, USD/NOK, NOK/SEK)
17:00 EUR Spanish GDP (Q2), Retail Sales (YoY) (Jun) (EUR/USD, EUR/JPY, EUR/GBP, IBEX)
18:00 EUR Italian Trade Balance Non-EU (Jun) (EUR/USD, EUR/JPY, EUR/CHF)
18:30 GBP BoE Consumer Credit, M3, M4, Mortgage Lending, Approvals, Net Lending to Individuals (Jun) (GBP/USD, EUR/GBP, GBP/JPY, FTSE 100)
19:30 EUR German 5-Year Bobl Auction (EUR/USD, EUR/GBP, EUR/JPY)
20:00 EUR France Jobseekers Total (Jun) (EUR/USD, EUR/JPY, EUR/GBP)
22:00 EUR Spanish Consumer Confidence (Jun) (EUR/USD, EUR/JPY, EUR/CHF)
22:30 USD Goods Trade Balance, Retail Inventories ex Auto, Wholesale Inventories(Jun) (EUR/USD, USD/JPY, GBP/USD, S&P 500)
22:55 USD Redbook (EUR/USD, USD/JPY, AUD/USD, S&P 500)
23:00 USD House Price Index, S&P/CS HPI Composite 20 s.a./n.s.a. (May) (USD/JPY, GBP/USD, EUR/USD, S&P 500)
00:00 USD CB Consumer Confidence (Jul), JOLTS Job Openings (Jun) (USD/JPY, EUR/USD, USD/CAD, S&P 500)
00:30 USD Dallas Fed Services Revenues, Texas Services Sector Outlook (Jul) (USD/JPY, USD/CAD, EUR/USD, S&P 500)
01:30 USD Atlanta Fed GDPNow (USD/JPY, EUR/USD, AUD/USD, S&P 500)
02:00 USD 7-Year Note Auction (USD/JPY, EUR/USD, GBP/USD, Treasury Markets)
View the full economic calendar
View the full economic calendar
-- Written by Matt Simpson
Follow Matt on Twitter @cLeverEdge
How to trade with City Index
You can trade with City Index by following these four easy steps:
- Open an account, or log in if you’re already a customer
• Open an account in the UK
• Open an account in Australia
• Open an account in Singapore
- Search for the market you want to trade in our award-winning platform
- Choose your position and size, and your stop and limit levels
- Place the trade
Related tags:
Latest market news




Open an account in minutes
Experience award-winning platforms with fast and secure execution, and enjoy tight spreads from 0.5 pts on FX and 0.3 pts on indices.
Economic calendar
Web Trader platform
Our sophisticated web-based platform is packed with features.
Related articles
GBP/USD, GBP/AUD: Sterling Rally Faces a BoE Reality Check
Sterling faces a reality check as the BoE prepares to hike rates. GBP/USD and GBP/AUD approach resistance, leaving bulls vulnerable to dovish guidance.
US Midterm Fallout: What Does the “Blue Tsunami” Mean for the S&P 500?
Democrats made sweeping gains in the US midterm elections, winning control of both the House and Senate - what does it mean for the S&P 500 and the AI trade?


S&P 500 forecast: Democrats’ midterm victory rattled markets before dip buyers stepped in
Markets had a wild overnight session, with futures initially plunging before staging a sharp reversal and turning decisively higher. Global equity markets also bounced back, alongside gold and silver, while the US dollar has weakened. Oil prices fell on hopes of a deal between the US and Iran, providing another boost to market sentiment. The key question is why have markets rebounded so strongly and, more importantly, whether the recovery can last, given the prior assumption that a blue sweep would have been net negative for stocks?

This report is intended for general circulation only. It should not be construed as a recommendation, or an offer (or solicitation of an offer) to buy or sell any financial products. The information provided does not take into account your specific investment objectives, financial situation or particular needs. Before you act on any recommendation that may be contained in this report, independent advice ought to be sought from a financial adviser regarding the suitability of the investment product, taking into account your specific investment objectives, financial situation or particular needs.
StoneX Financial Pte. Ltd., may distribute reports produced by its respective foreign entities or affiliates within the StoneX group of companies or third parties pursuant to an arrangement under Regulation 32C of the Financial Advisers Regulations. Where the report is distributed to a person in Singapore who is not an accredited investor, expert investor or an institutional investor (as defined in the Securities Futures Act), StoneX Financial Pte. Ltd. accepts legal responsibility to such persons for the contents of the report only to the extent required by law. Singapore recipients should contact StoneX Financial Pte. Ltd. at 6826 9988 for matters arising from, or in connection with the report.
In the case of all other recipients of this report, to the extent permitted by applicable laws and regulations neither StoneX Financial Pte. Ltd. nor its associated companies will be responsible or liable for any loss or damage incurred arising out of, or in connection with, any use of the information contained in this report and all such liability is hereby expressly disclaimed. No representation or warranty is made, express or implied, that the content of this report is complete or accurate.
StoneX Financial Pte. Ltd. is not under any obligation to update this report.
Trading CFDs carries a high level of risk that may not be suitable for some investors. Consider your investment objectives, level of experience, financial resources, risk appetite and other relevant circumstances carefully. The possibility exists that you could lose some or all of your investments, including your initial deposits. If in doubt, please seek independent expert advice. Visit www.forex.com/en-sg/terms-and-policies for the complete Risk Disclosure Statement.