



S&P 500 Forecast for the Week Ahead: Fresh SPX ATHs Despite Growing Bubble Fears
Is it a bubble or just a mania? While AI holds a lot of promise the valuations are becoming untethered from historical norms but that doesn’t necessarily mean that prices need to come down.
Share this:

S&P 500 Talking Points:
- The S&P 500 hit another fresh ATH this week and the weakness that took over after the June FOMC rate decision has taken a back seat to bullish continuation.
- The big question now is whether SPX can hit the 8k level as current resistance has built at the 7800 psychological level.

Talk of an AI bubble is rampant and like I highlighted in the 2025 equities forecast, there’s several similarities in the AI trade and the dot com trade from two decades ago. And while a sample size of one is a dangerous point from which to draw comparison, the fact of the matter is that a market that builds exuberant valuations based on high expectations, and fueled by relatively low rates, is vulnerable to strong pullbacks when even the slightest hint or whiff of change presents itself.
What differs from here and the 1999/2000, however, is the interest rate dynamic. With Treasury rates relatively low, from 4-5%, there’s simply a dearth of attractive options for investors when pullbacks or scares shock capital out of equity markets. In the year 2000, the 30-year bond jumped up to a high of 6.71% after bottoming at 200 basis points lower just 15 months earlier.
When stocks dipped in Q1 of 2000, there was an open door for capital to flow into bonds – and away from stocks and suddenly, chasing the dip on overvalued tech stocks that had yet to produce a net profit wasn’t so attractive. And that’s one of the factors that ultimately led into the massive drawdown that showed up later that year.
As investors bought bonds yields went down and that’s a relationship that’s largely held true for the past two decades, with another major jump in prices (and reduction in yields) after the financial collapse and then another after the onset of Covid.
More recently, however, yields have been ticking up. The 30-year bond set a fresh 19-year high on yields just two weeks ago and the Treasury department is facing a maturity wall as one-third of their issuance is coming due over the next 12 months. Much of this, of course, will be financed by shorter-term bonds, like three or nine month T-bills. But, not all will, and this oncoming supply is enough to frighten bond market participants that are currently holding Treasuries as an increase in supply and a reduction in prices will drive yields higher. And for those that are already long, that means their portfolios will drop in value simply by holding those bonds and this creates a conundrum – either hold Treasury paper that will likely show an unrealized loss – or – chase overbought tech stocks despite the rampant valuations that are rivaling what showed in the dot com boom of the late 90’s.
The choice has been clear thus far and, at this point, there’s still a justifiable backdrop for owning stocks, even if valuations are stretched. But, over the next year that equation can change and that’s precisely what I addressed in this video for StoneX:
The Treasury Maturity Wall Presents a Risk to the AI Boom
This content was created by an affiliate of FOREX.com and represents the views and opinions of the author/speakers, not the views and opinions of Forex.com, StoneX Group Inc., or its subsidiaries. The content has not been independently reviewed by FOREX.com.
What Builds a Bubble And When Does it Begin to Matter?
What I remember vividly from the dot com bubble which resembles today so well is just how it was so widely discussed whether we were in a bubble. And the argument essentially boils down to those that think that we are and then those that think that it some new paradigm; that things haven’t blown up yet and this new technology is so great that there’s a reason that this time is different.
But I think the reality is simpler than that. Market participants are constantly seeking the greatest risk adjusted return. And if stocks sell off by 20% in a couple of weeks and many market participants have moved into cash – and there’s no requisite option to deploy that cash – well – looking for stocks to re-ascend becomes a fairly attractive thesis.
And with bond yields low because the Treasury is buying or because the Fed doesn’t want to hike despite inflation becoming untethered, like in 2021, there’s simply a lack of options outside of stocks for that capital to flow to. Thus, those violent episodes of sell-off produce pullbacks.
But for a bond investor, there’s little that’s more attractive than buying bonds at a relatively high yield, and then holding as rates fall. Because now the principal value on those bonds goes up and the investor has the choice to either clip above-market coupons for the duration of that bond or to sell it in the marketplace for a premium, at which point they can re-employ capital into riskier asset classes that have just undergone a haircut.
The problem is that for the past almost 20 years this hasn’t really been an option, partly because the Federal Reserve has been suppressing the market by inserting artificial demand. And those low rates compel investors to take on more risk while making the prospect of buying bonds (with low yields) as seemingly unattractive.
But now – there’s the very real prospect of yields going up just based on how much debt the Treasury will need to sell in the coming months. And as this supply hits the market, prices can go down, yields can go up and, eventually, buying the 19th or 20th dip in tech stocks may not be such an attractive prospect any longer.
US 30-Year Yields Past 30 Years, Fresh 19-Year Highs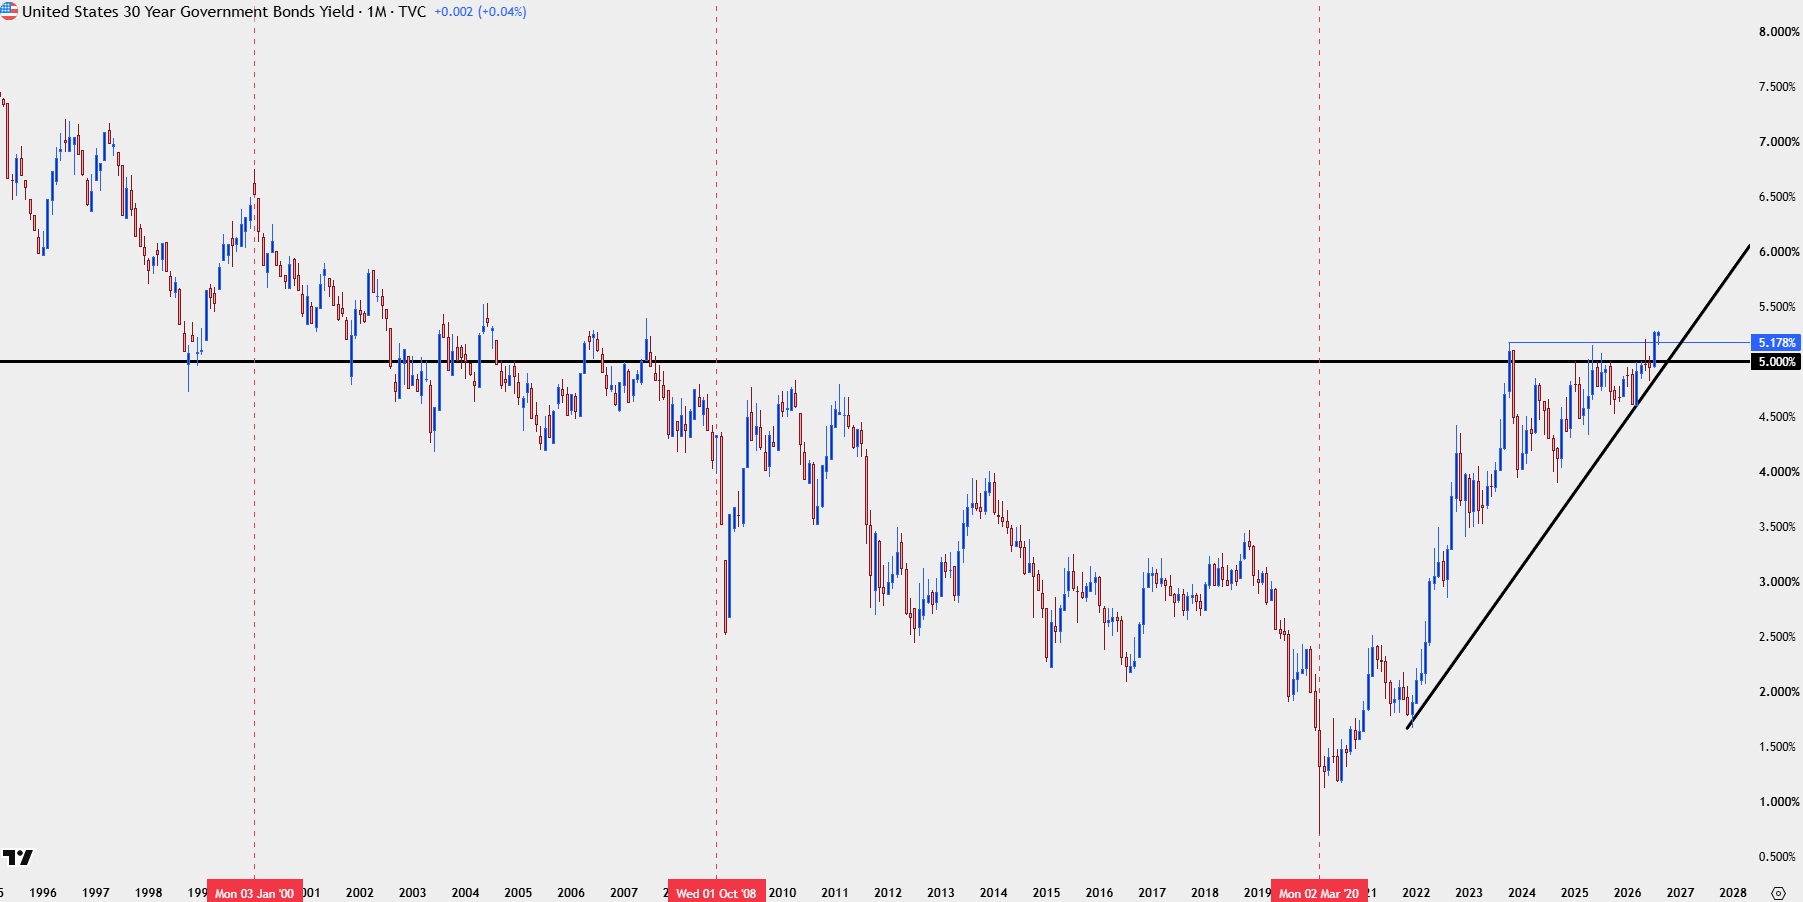
Chart prepared by James Stanley; data derived from Tradingview
SPX Strategy For Now
Everything above is a big picture backdrop, and this is perhaps what’s most confusing for traders as there’s seeming misalignment with what seems like should happen and what actually happens.
And the fact that stocks did spent much of the late 90’s rallying higher with that surrounding backdrop of valuations or lack of profitability not really mattering, it harkens the Nassim Taleb analogy about the life of a turkey. For 363 days a year, the turkey lives a great life and would know of no harm. But suddenly, matters can turn very abruptly a few days before Thanksgiving.
So, these factors don’t really matter until they do and when they do, the change can happen so quickly that much gets lost in the shuffle. This is why Wall Street’s favorite trade is often akin to picking up pennies in front of the steamroller. Because while the steamroller is painful and catastrophic, the idea of leaving money on the tracks without at least trying to pick it up seems foolish when much of the crowd is already doing so.
At this point the rally in equities has continued and there’s little reason to question that. If we do see a selling event, perhaps it happens on the back of Iran or higher oil prices or something else that ‘feels’ like a black swan at the time but really turns out to be just another driver of a pullback, there’s still reason for buyers to jump on the bid.
But – in the not-too-distant future, that may be changing. If we do see Treasury yields spike higher as the US Treasury department re-issues a mountain of debt, there will soon be a very attractive opportunity cost for market participants that does not involve chasing a stretched trade, and that is when the AI boom can start to deflate.
Until then, and like the equity forecasts for the past two years, pullbacks are opportunities for bullish continuation and at this point for SPX, it’s that zone of prior resistance where there’s some remaining unfilled gap that stands out for support potential. That’s from around 7600-7630, and for more aggressive stances, it’s the spot from 7700-7718.
SPX Daily Price Chart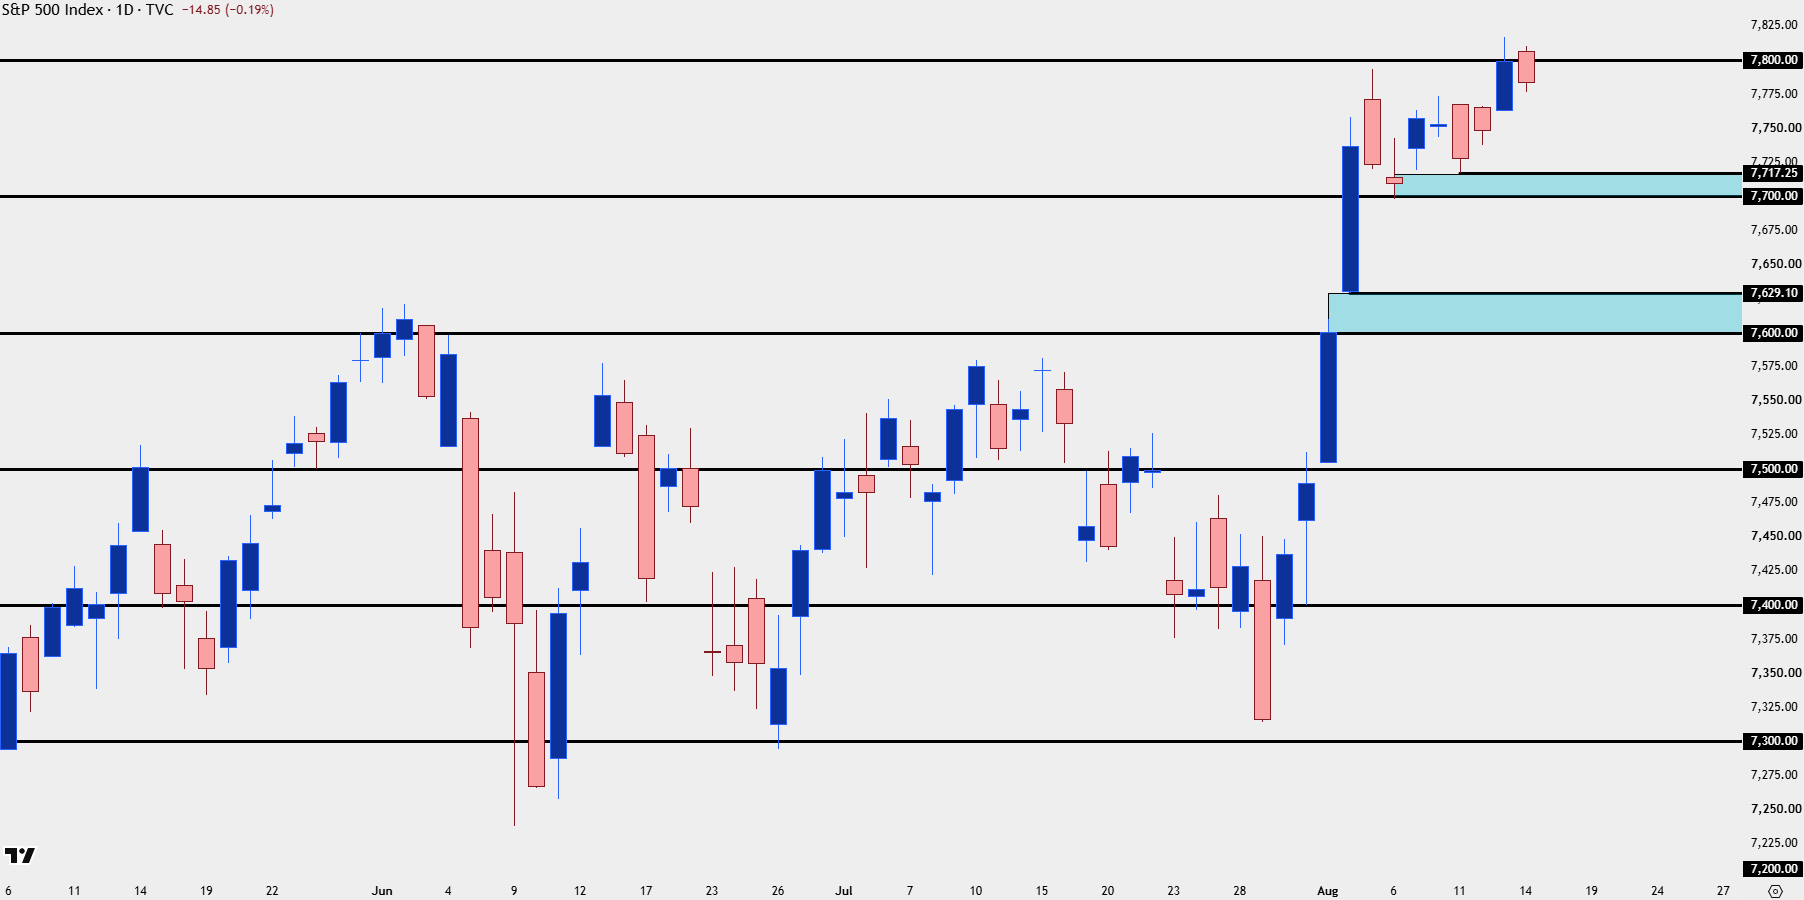
Chart prepared by James Stanley; data derived from Tradingview
--- written by James Stanley, Senior Market Analyst, Global Macro
Related tags:
Latest market news




Open an account in minutes
Experience award-winning platforms with fast and secure execution, and enjoy tight spreads from 0.5 pts on FX and 0.3 pts on indices.
Economic calendar
Web Trader platform
Our sophisticated web-based platform is packed with features.
Related articles
Gold Rallies Towards a $4k Test – but Can Bulls Break the Trend?
Gold prices melted down last week but so far this week, a different tone has taken over. But can this turn into anything more than a short squeeze?


EUR/USD Clings to Support as Lagarde Announces Early Departure
EUR/USD has been mired in a steep sell-off as worries have built around French yields, but continued support around the 1.1100 level give hope for a bounce that could possibly turn into something more.
This report is intended for general circulation only. It should not be construed as a recommendation, or an offer (or solicitation of an offer) to buy or sell any financial products. The information provided does not take into account your specific investment objectives, financial situation or particular needs. Before you act on any recommendation that may be contained in this report, independent advice ought to be sought from a financial adviser regarding the suitability of the investment product, taking into account your specific investment objectives, financial situation or particular needs.
StoneX Financial Pte. Ltd., may distribute reports produced by its respective foreign entities or affiliates within the StoneX group of companies or third parties pursuant to an arrangement under Regulation 32C of the Financial Advisers Regulations. Where the report is distributed to a person in Singapore who is not an accredited investor, expert investor or an institutional investor (as defined in the Securities Futures Act), StoneX Financial Pte. Ltd. accepts legal responsibility to such persons for the contents of the report only to the extent required by law. Singapore recipients should contact StoneX Financial Pte. Ltd. at 6826 9988 for matters arising from, or in connection with the report.
In the case of all other recipients of this report, to the extent permitted by applicable laws and regulations neither StoneX Financial Pte. Ltd. nor its associated companies will be responsible or liable for any loss or damage incurred arising out of, or in connection with, any use of the information contained in this report and all such liability is hereby expressly disclaimed. No representation or warranty is made, express or implied, that the content of this report is complete or accurate.
StoneX Financial Pte. Ltd. is not under any obligation to update this report.
Trading CFDs carries a high level of risk that may not be suitable for some investors. Consider your investment objectives, level of experience, financial resources, risk appetite and other relevant circumstances carefully. The possibility exists that you could lose some or all of your investments, including your initial deposits. If in doubt, please seek independent expert advice. Visit www.forex.com/en-sg/terms-and-policies for the complete Risk Disclosure Statement.