



SPX, Nasdaq 100 Forecast for the Week Ahead
SPX just finished its strongest month since 2020 when Covid stimulus was still fueling markets, and buyers continue to show an insatiable appetite for risk despite several dark clouds on the horizon.
Share this:


Coming into this year I wrote the equities portion of this year’s forecast, and I warned of a ‘melt up’ situation as we had a degree of alignment between fiscal and monetary policy; and despite exuberant valuations already showing in stocks, there remained an open door for investors get even more frantic. But – as always in trading, timing matters, and I had highlighted the ideal scenario where a pullback could allow for entry into bullish trend continuation scenarios.
That scenario arrived in February and March as the United States made a move on Iran, and two months later even with an abundance of questions around oil supplies and the Strait of Hormuz, US equities have jumped to fresh all-time-highs. At the low, SPX saw daily RSI sink to oversold territory and since then bulls have staged a remarkable come back, with buying activity so frenzied that there remain numerous unfilled gaps from along the way in the cash index.
SPX Daily Price Chart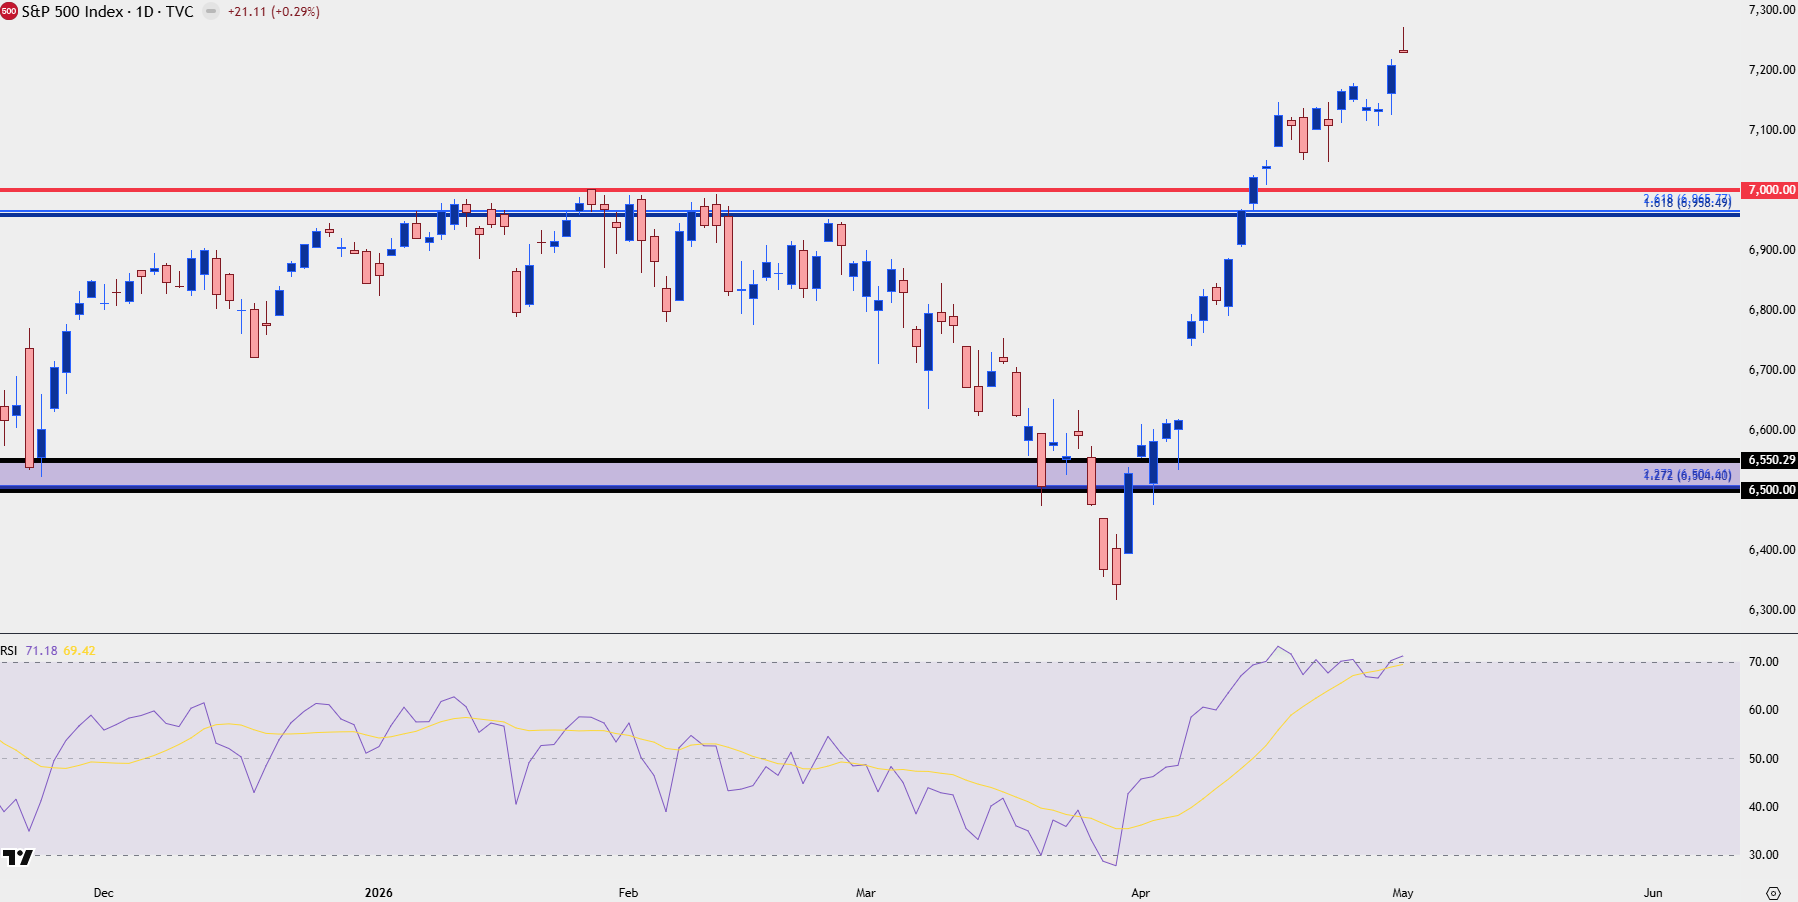
Chart prepared by James Stanley; data derived from Tradingview
SPX Strategy v/s Emotion
As you can also see from the above chart, RSI is overbought and of late has been diverging. I don’t necessarily look to RSI as a timing indicator as it’s quite laggy, particularly for counter-trend moves, but it does highlight the challenge of chasing at current levels.
Also of note, and something I’ll talk about in greater detail regarding the Nasdaq 100 below, is the performance of NVDIA, which rallied by more than 31% in a little more than four weeks to create another fresh all-time-high – and this is for a $4 Trillion Dollar company, which is just outlandish to consider. But, that’s sentiment showing and investors responded in a big way to a clean 23.6% pullback in the market leader.
For SPX, this highlights the danger of chasing and, instead, points to the power of patience. At this point, we haven’t yet seen a test of show of support at the 7k psychological level that was previously a hard spot of resistance. I’ve got that spanned down to my 2025 top-end target of 6958, which is a Fibonacci projection level, to create a zone to look for higher-low support. Below that, we have two unfilled gaps, from 6887-6905 and then from 6618-6740. And lastly, another area of prior resistance spanning from 6500-6550.
SPX Daily Price Chart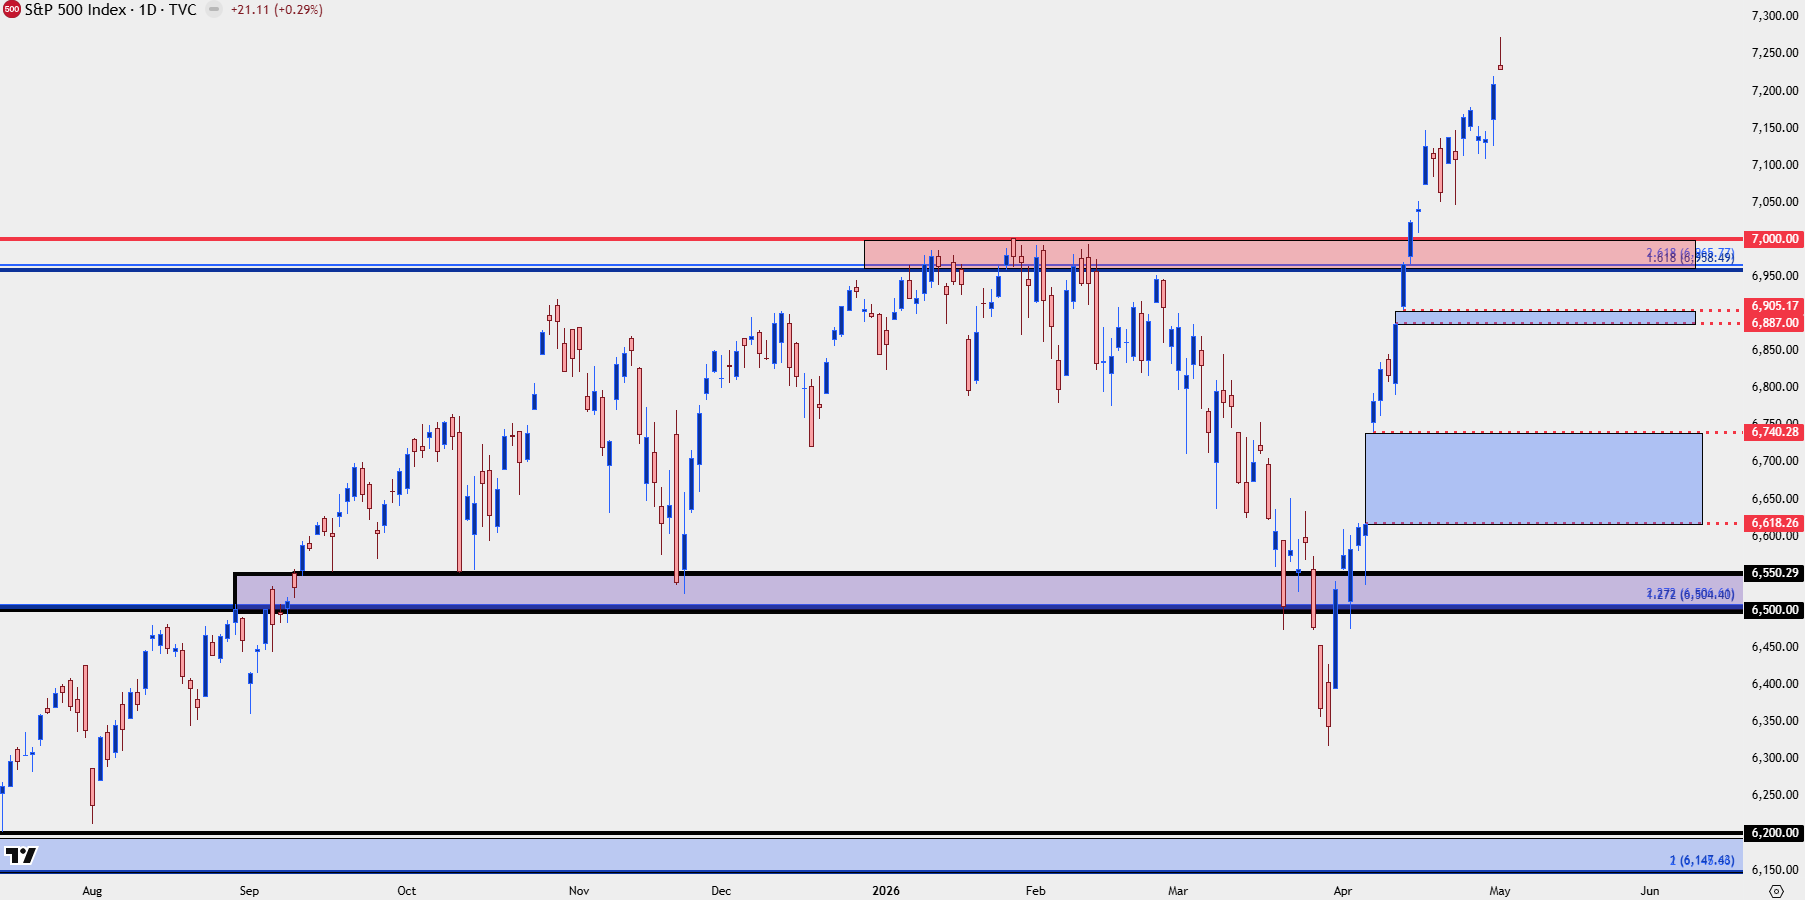
Chart prepared by James Stanley; data derived from Tradingview
Nasdaq
Even as the sell-off was hitting hard during March in the S&P 500, the Nasdaq had held up a bit better on a relative degree. This is what points to the fact that even with fear gripping markets, investors remained optimistic that, eventually, economic growth would prevail. And they used that pullback in premium names like NVDIA to add or start positions, which eventually ran to a fresh ATH.
But this is now a factor to consider if thinking of chasing, as NVDA just posted a red week with a bearish engulf, indicating that investors this week used the rally to fresh ATHs to pare positions. This doesn’t necessarily denote reversal, but it does highlight both the danger of chasing and the possible power of patience.
There’s now a big spot of support as taken from prior resistance around 192.69, and below that, the 164.66 Fibonacci level stands out as that’s what’s previously been defended. If we get below that I’m of the mind that something will have shifted in the backdrop, but that would also open up the possibility of a support test at the 150 level which was also a prior spot of resistance.
NVDA Weekly Chart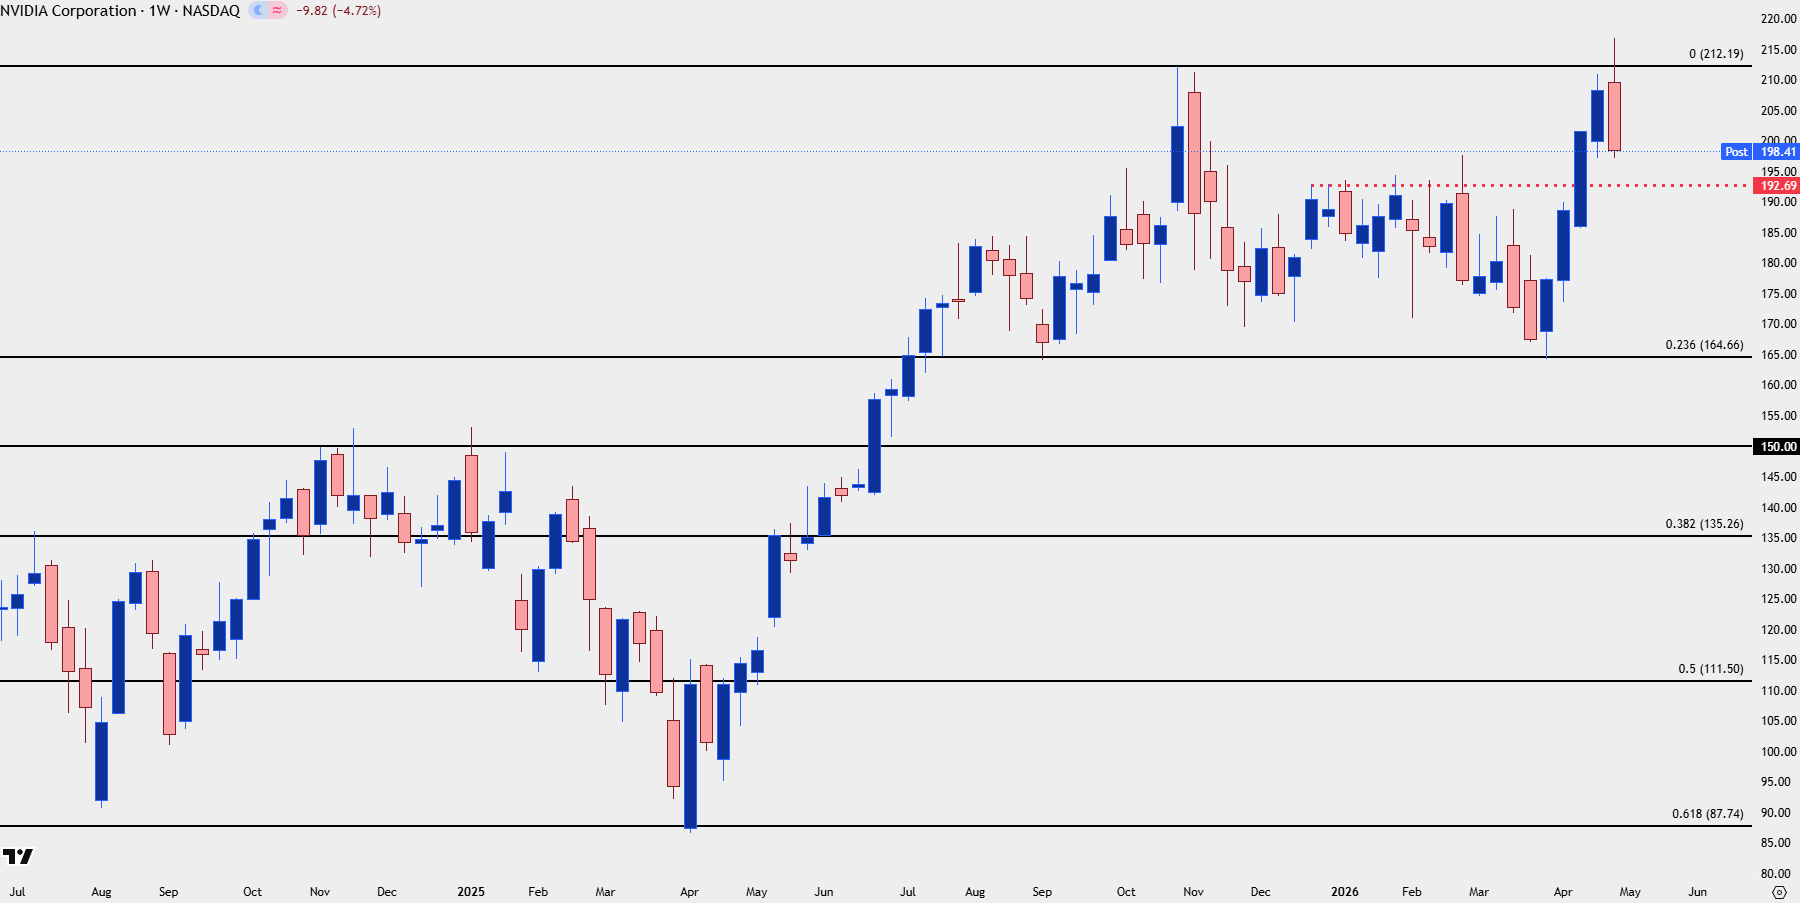
Chart prepared by James Stanley; data derived from Tradingview
Nasdaq 100
For the broader tech index, bulls have continued to rip, with prices pushing five strong weeks and a monthly gain for April of more than 15% in NQ futures. From support at 23k it’s basically been a straight shot-higher nearing the 28k mark, and while that momentum is enticing it’s simply dangerous to chase such a well developed move.
For support, the prior ATH of 26,400 stands out, with the area around 25k-25,465 just below that. And even a re-test of the 24k area could be argued as a higher-low, although like NVDA above, for that scenario to develop it would be wise to consider what change may have taken place in the backdrop.
Nasdaq 100 Weekly Price Chart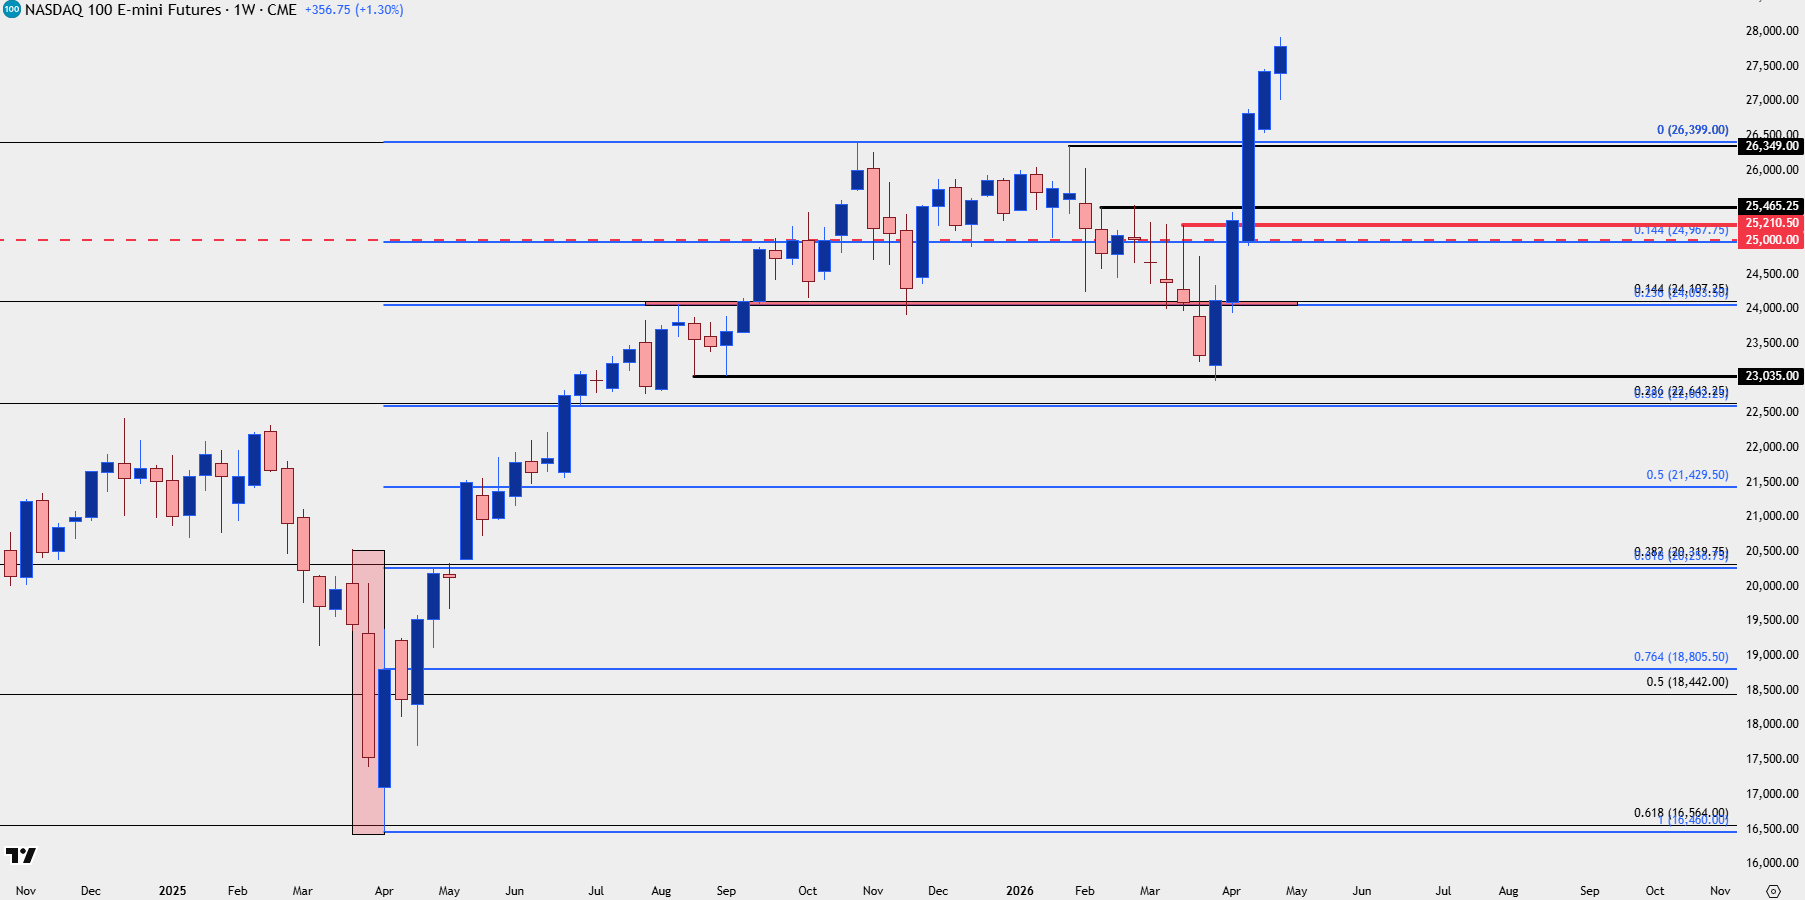
Chart prepared by James Stanley; data derived from Tradingview
--- written by James Stanley, Senior Market Analyst, Global Macro
Related tags:
Latest market news




Open an account in minutes
Experience award-winning platforms with fast and secure execution, and enjoy tight spreads from 0.5 pts on FX and 0.3 pts on indices.
Economic calendar
Web Trader platform
Our sophisticated web-based platform is packed with features.
Related articles
USD Exhaustion into Bearish Engulf: EUR/USD, GBP/USD, USD/JPY
It was a big week for the Dollar with stronger inflation pushing rate hike themes, with price action diverging as price printed a bearish engulf on the weekly DXY chart.
S&P 500 Forecast: SPX set for a weekly decline led lower by tech as AI worries linger
U.S. stocks have opened mixed as investors continue to worry about the financing behind the AI trade while also looking ahead to more earnings next week.


Magnificent Seven Earnings Preview: Is the AI Boom Facing Its Biggest Test Yet?
After a wobble in the broader AI trade, the Magnificent Seven" stocks are reporting earnings in the coming week - see the key themes and Nasdaq 100 levels to watch!

This report is intended for general circulation only. It should not be construed as a recommendation, or an offer (or solicitation of an offer) to buy or sell any financial products. The information provided does not take into account your specific investment objectives, financial situation or particular needs. Before you act on any recommendation that may be contained in this report, independent advice ought to be sought from a financial adviser regarding the suitability of the investment product, taking into account your specific investment objectives, financial situation or particular needs.
StoneX Financial Pte. Ltd., may distribute reports produced by its respective foreign entities or affiliates within the StoneX group of companies or third parties pursuant to an arrangement under Regulation 32C of the Financial Advisers Regulations. Where the report is distributed to a person in Singapore who is not an accredited investor, expert investor or an institutional investor (as defined in the Securities Futures Act), StoneX Financial Pte. Ltd. accepts legal responsibility to such persons for the contents of the report only to the extent required by law. Singapore recipients should contact StoneX Financial Pte. Ltd. at 6826 9988 for matters arising from, or in connection with the report.
In the case of all other recipients of this report, to the extent permitted by applicable laws and regulations neither StoneX Financial Pte. Ltd. nor its associated companies will be responsible or liable for any loss or damage incurred arising out of, or in connection with, any use of the information contained in this report and all such liability is hereby expressly disclaimed. No representation or warranty is made, express or implied, that the content of this report is complete or accurate.
StoneX Financial Pte. Ltd. is not under any obligation to update this report.
Trading CFDs carries a high level of risk that may not be suitable for some investors. Consider your investment objectives, level of experience, financial resources, risk appetite and other relevant circumstances carefully. The possibility exists that you could lose some or all of your investments, including your initial deposits. If in doubt, please seek independent expert advice. Visit www.forex.com/en-sg/terms-and-policies for the complete Risk Disclosure Statement.