





DAX, FTSE and gold outlook - Technical Tuesday
With the US out celebrating Independence Day holiday, it should be a quieter day than usual as several key markets will be closed for trading. With that in mind, this edition of Technical Tuesday is going to be a lighter one. We will get technical on the gold outlook and provide analysis on the FTSE and DAX.
Share this:
With the US out celebrating Independence Day holiday, it should be a quieter day in the markets. With that in mind, this edition of Technical Tuesday is going to be a light one. We will get technical on the gold outlook and provide analysis on the FTSE and DAX.
FTSE outlook: UK index needs to reclaim 200-day
The FTSE has stabilised in the last few sessions, finding good support around 7400-7500 range, where it had previously staged a breakout from at the end of March. Back then, the bears were trying to hold the index below the 200-day average, but it was a bit like keeping a ball in water. As soon as it was released, it shot higher. Now, we are in a similar situation again with the 200-day, now at 7550ish, is trying to hold the index down. If it gives way, then expect the FTSE to rally sharply.
Source: TradingView.com
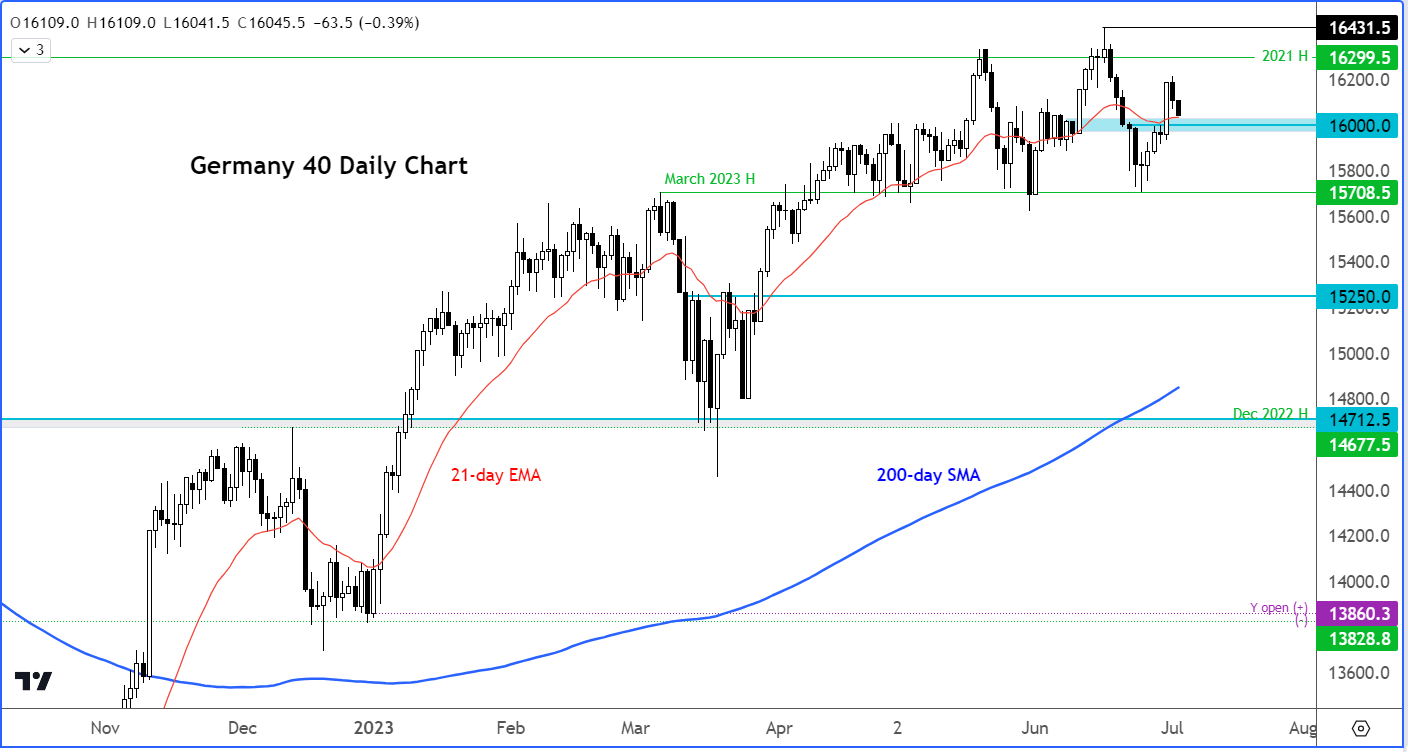
DAX outlook: German index testing key support
Despite all the economic uncertainty across the Eurozone, the German index has had a great year, reaching a fresh all-time high in mid-June. But since then, it has turned a bit more volatile, initially staging a sharp sell-off and then rebounding strongly, before falling again at the start of this week. All told, there’s little technical evidence to suggest the bullish trend is over just yet. So, we will look for support levels to hold and resistances to break. One such support level is around 16000 (give or take 20 points), the base of Friday’s breakout. Once resistance, this area could turn into support and trigger another wave of buying pressure. We will only entertain the bearish case should this level give way decisively on a closing basis.
Source: TradingView.com
Gold outlook: Can metal break out of wedge?
Gold has been trending lower inside a falling wedge pattern ever since its breakout to a new all-time high in May failed to hold. The bulls have been disappointed with the lack of upside follow-through, thanks to rising bond yields amid renewed push by major central banks to tame stubborn inflation.
The bullish trend ended in May when the breakout above the August 2020 record high of $2075 immediately failed. Subsequently, gold went on to break below its 21-day moving average, which is a popular short-term trend indicator. This MA has consistently provided resistance to any gold advance during June. We are now very close to testing it again, with the metal also approaching $1932 resistance level.
Conservative gold traders will now want to see if the buyers will show up and push the price of gold through the above resistance area and therefore the trend resistance of the falling wedge pattern, or we simply resume lower again.
For now, the short-term gold outlook remains bearish as price continues to break down short-term support levels and gets offered on any bounces. Will that change later this week? Well, a lot will now depend on incoming data and we have plenty of that starting Wednesday, when US investors are also back in town.
Key support levels such as $2000, $1980 and now $1932ish have broken down. The latter is now the most important short-term level to watch as price tests it from underneath. For as long as gold holds below this $1932 level, the path of least resistance would remain to the downside towards $1900. Below $1900, the next big level is around $1850/55 area, which marks the base of the breakout in March and the 200-day average.
Source: TradingView.com
How to trade with City Index
You can trade with City Index by following these four easy steps:
- Open an account, or log in if you’re already a customer
• Open an account in the UK
• Open an account in Australia
• Open an account in Singapore
- Search for the company you want to trade in our award-winning platform
- Choose your position and size, and your stop and limit levels
- Place the trade
Technical analysis FAQs
What is technical analysis?
Technical analysis is a method used to evaluate financial markets using historical price data to identify trends and patterns. The theory is that previous trading activity can give insight into future price movements.
Learn more about technical analysis
Learn more about technical analysis
How do I get the latest USD/JPY news?
You can get the latest USD/JPY news and price movements from our in-house team of experts.
Head to our news and analysis section for the most recent updates. Alternatively, you can access a live Reuters newsfeed on our trading platform.
Head to our news and analysis section for the most recent updates. Alternatively, you can access a live Reuters newsfeed on our trading platform.
How do you analyse DXY?
You analyse the US dollar index (DXY) in the same way you would a currency pair or stock index. The key difference is it’s not just one currency against another, but the dollar against six others. So, if the dollar is expected to decline against one – but not all – of the currencies, the DXY may not move.
Learn more about the dollar index
Learn more about the dollar index
What does it mean if DXY goes up?
If the US dollar index (DXY) goes up, it means that the US dollar is gaining in value compared to a basket of other global currencies. Alternatively, if the DXY falls, it means the dollar has lost strength in comparison to other currencies.
See our guide to the US dollar
See our guide to the US dollar
What is the best indicator for GBP/USD?
Technical analysis of the British pound against the US dollar (GBP/USD) is commonly based on indicators such as moving averages and oscillators. These give traders insights into the direction and strength of trends and areas of support and resistance.
Discover the most popular technical indicators
Discover the most popular technical indicators


Open an account in minutes
Experience award-winning platforms with fast and secure execution, and enjoy tight spreads from 0.5 pts on FX and 0.3 pts on indices.
Economic calendar
Web Trader platform
Our sophisticated web-based platform is packed with features.
Related articles
ASX 200 Outlook: A Rates Trade Disguised as a Stock Market?
Australian bond futures have exhibited a far stronger relationship with the ASX 200 than Wall Street over recent months. Now both markets are displaying remarkably similar price structures.

AUD/USD Bulls Fight Back After Australian Jobs Shock
AUD/USD has been hit by another ugly Australian employment report, sending RBA rate hike expectations sharply lower. Yet the relationships driving the currency have shifted since quarter-end, and improving risk appetite could provide the fuel for a recovery.

Bitcoin Bulls Eye Weekend Bounce as Nasdaq Finds Support
Bitcoin bulls eye a weekend bounce as Nasdaq finds support, BTC holds $80k and bullish reversal signals emerge alongside stronger correlations.

This report is intended for general circulation only. It should not be construed as a recommendation, or an offer (or solicitation of an offer) to buy or sell any financial products. The information provided does not take into account your specific investment objectives, financial situation or particular needs. Before you act on any recommendation that may be contained in this report, independent advice ought to be sought from a financial adviser regarding the suitability of the investment product, taking into account your specific investment objectives, financial situation or particular needs.
StoneX Financial Pte. Ltd., may distribute reports produced by its respective foreign entities or affiliates within the StoneX group of companies or third parties pursuant to an arrangement under Regulation 32C of the Financial Advisers Regulations. Where the report is distributed to a person in Singapore who is not an accredited investor, expert investor or an institutional investor (as defined in the Securities Futures Act), StoneX Financial Pte. Ltd. accepts legal responsibility to such persons for the contents of the report only to the extent required by law. Singapore recipients should contact StoneX Financial Pte. Ltd. at 6826 9988 for matters arising from, or in connection with the report.
In the case of all other recipients of this report, to the extent permitted by applicable laws and regulations neither StoneX Financial Pte. Ltd. nor its associated companies will be responsible or liable for any loss or damage incurred arising out of, or in connection with, any use of the information contained in this report and all such liability is hereby expressly disclaimed. No representation or warranty is made, express or implied, that the content of this report is complete or accurate.
StoneX Financial Pte. Ltd. is not under any obligation to update this report.
Trading CFDs carries a high level of risk that may not be suitable for some investors. Consider your investment objectives, level of experience, financial resources, risk appetite and other relevant circumstances carefully. The possibility exists that you could lose some or all of your investments, including your initial deposits. If in doubt, please seek independent expert advice. Visit www.forex.com/en-sg/terms-and-policies for the complete Risk Disclosure Statement.