


Dow Jones Analysis: Is the DJIA Making a Comeback?
Recent trading sessions have become increasingly relevant for the Dow Jones, as the index has started to regain bullish momentum heading into the end of the week. Over the last three sessions, the DJIA has advanced by more than 0.6%, allowing buying pressure to regain prominence and raising the possibility of a more consistent short-term recovery.
Share this:

Recent trading sessions have become increasingly relevant for the Dow Jones, as the index has started to regain bullish momentum heading into the end of the week. Over the last three sessions, the DJIA has advanced by more than 0.6%, allowing buying pressure to regain prominence and raising the possibility of a more consistent short-term recovery.
For now, this move appears to be supported by two main factors. On one hand, the relative attractiveness of the U.S. bond market has begun to fade following a recent moderation in yields. On the other, the index's largest components continue to display relatively stable performance, helping to preserve confidence around the Dow Jones. As long as these conditions remain in place, buying pressure could continue to be relevant in the sessions ahead.

Are Lower Bond Yields Beginning to Support the Market?
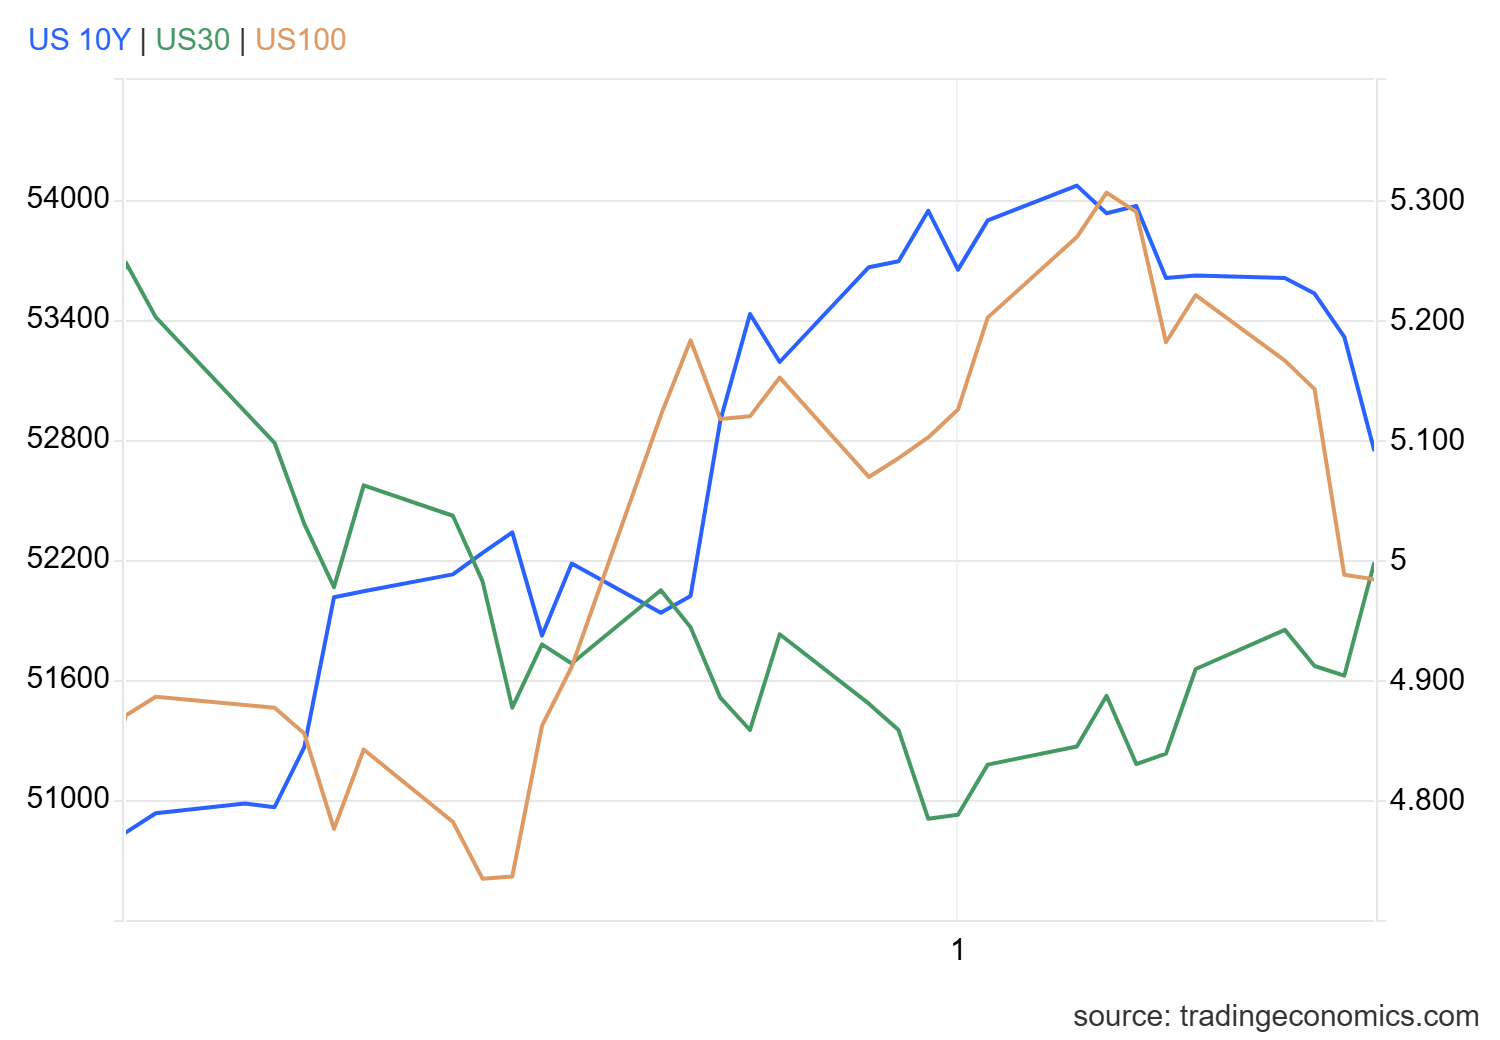
Over recent sessions, a moderation in 10-year U.S. Treasury yields has become increasingly evident. Part of this move follows recent comments from Federal Reserve officials, who suggested that there is currently no immediate need to adopt a more aggressive monetary policy stance during October. As a result, markets have begun to scale back expectations of a more aggressive central bank in the short term, with Treasury yields retreating toward the 5.0% area after reaching recent highs.
This environment tends to be supportive for equity markets, as less aggressive rate expectations help maintain more stable financial conditions while reducing some of the relative attractiveness of fixed-income assets. What makes the current situation particularly interesting, however, is that not all U.S. equity indices are responding in the same way.
While the Nasdaq 100 continues to face pressure from ongoing concerns surrounding the technology sector and elevated valuations, the Dow Jones has managed to sustain a more consistent recovery. This divergence suggests that part of investor demand may be rotating toward sectors perceived as more defensive within the U.S. equity market. Due to its composition, the Dow has benefited from lower bond yields without being as directly exposed to the concerns currently weighing on the technology sector. As a result, the index is beginning to stand out as a relatively more stable alternative and has once again attracted buying interest during the short term.
Source: TradingEconomics
All of this remains important because the market appears to be facing less competition from alternative investments such as bonds in the short term, while the Dow Jones continues to display stronger stability than several major U.S. equity benchmarks. This dynamic has helped support demand and may continue to underpin the buying pressure observed in recent sessions.
Can Demand Remain Strong?
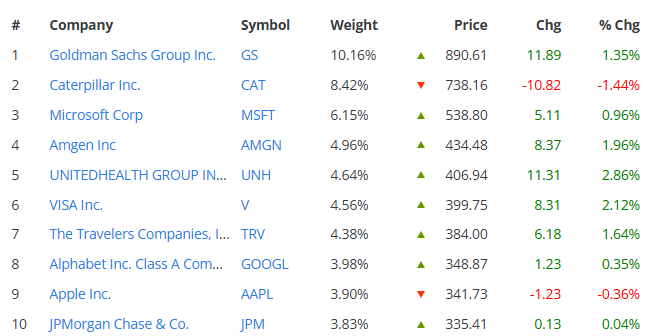
It is also important to monitor the performance of Dow Jones' largest components. During the latest session, only two of the ten largest constituents posted losses: Caterpillar (-1.44%) and Apple (-0.36%). The remaining major components delivered either positive or relatively stable performance.
Among the strongest performers, UnitedHealth (+2.86%) stood out following better-than-expected earnings results and improved full-year guidance. Amgen (+1.96%) also posted solid gains, benefiting from a rotation of capital toward more defensive sectors, while Travelers (+1.64%) reflected a similar dynamic.
This remains important because the recent strength in the Dow Jones is not solely dependent on isolated corporate developments. Part of the stability comes from the defensive nature of many of its components, a characteristic that tends to become increasingly attractive when more cyclical segments of the market, such as technology, begin to lose momentum.
Source: Slickcharts
With this in mind, Dow's constituents continue to act as recipients of capital flows seeking exposure to more defensive sectors within the U.S. equity market. As long as this dynamic remains in place and concerns persist around more sensitive segments of the market, demand for Dow Jones could continue to display stability and support a constructive bias in the sessions ahead.
Dow Jones Technical Forecast
Source: StoneX, Tradingview
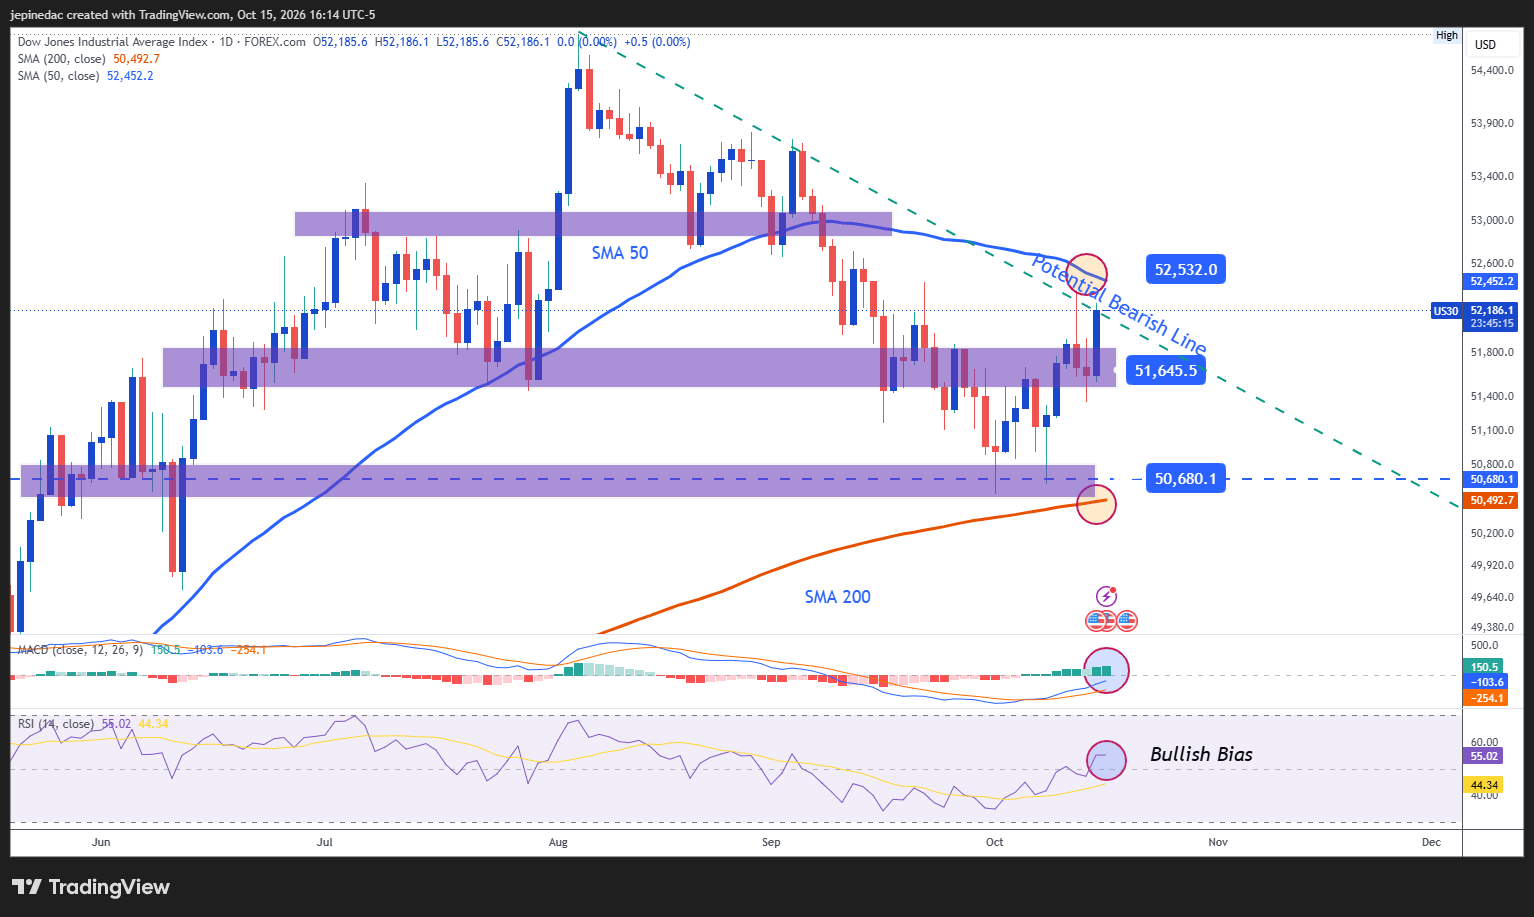
- The bearish trendline is entering a risk zone: For several weeks, the Dow Jones developed a sequence of lower lows that contributed to the formation of a bearish structure on the daily chart. However, the recent rebound has begun to place this technical reference under pressure as price approaches the primary bearish trendline once again. If buying pressure continues to strengthen and key resistance levels are overcome, a breakout of this structure could begin to take shape and open the door to a more consistent bullish trend.
- RSI: The RSI has moved above the 50 neutral level, a reading that reflects improving bullish momentum. As long as this dynamic remains in place, the bullish bias could continue gaining relevance in the coming sessions.
- MACD: A similar picture can be observed in the MACD, whose histogram continues to trade above the 0 neutral line. This reading supports the recent strength in short-term moving averages and reinforces the importance of the bullish bias that has emerged in recent days.
Key Levels:
- 52,500 points – Key Resistance: This level represents the most important upside barrier on the chart, located above the bearish trendline and close to the 50-period simple moving average. A sustained move above this area could signal a meaningful shift in market structure and support a more consistent bullish trend.
- 51,700 points – Near-Term Barrier: An important equilibrium zone that aligns with retracement levels observed in previous weeks. If price continues to develop around this area, a more neutral environment could remain in place and support the formation of a broader trading range in the short term.
- 50,700 points – Key Support: A major support level that aligns with both previous lows and the 200-period simple moving average. A break below this area could significantly alter the current structure of the chart and restore the long-term bearish trendline as the dominant technical pattern in the weeks ahead.
Written by Julian Pineda, CFA, CMT – Market Analyst
Follow him on: @julianpineda25




Open an account in minutes
Experience award-winning platforms with fast and secure execution, and enjoy tight spreads from 0.5 pts on FX and 0.3 pts on indices.
Economic calendar
Web Trader platform
Our sophisticated web-based platform is packed with features.
Related articles
Dow Jones Analysis: Is the DJIA Making a Comeback?
Recent trading sessions have become increasingly relevant for the Dow Jones, as the index has started to regain bullish momentum heading into the end of the week. Over the last three sessions, the DJIA has advanced by more than 0.6%, allowing buying pressure to regain prominence and raising the possibility of a more consistent short-term recovery.

Dow Jones outlook: CPI, oil and yields put the rally to the test
US index futures rebounded in the first half of Wednesday’s session, along with European indices ahead of the release of US CPI. Some slightly dovish remarks from the Fed’s Williams seem to have helped sentiment a little, but whether those comments will be backed by data remains to be seen. While slightly hotter than expected inflation data shouldn’t be enough for markets to price in an October Fed hike with more than a coin flip probability, it can nonetheless reinforce expectations of further tightening later in the year.


Dow Jones Forecast: DJIA rises as Oil slips and Treasury yields pause
U.S. stocks are rising on Friday as oil prices ease on signs of reduced Middle East supply risks, although the telecom sector remains under pressure following SpaceX’s acquisition deal.

This report is intended for general circulation only. It should not be construed as a recommendation, or an offer (or solicitation of an offer) to buy or sell any financial products. The information provided does not take into account your specific investment objectives, financial situation or particular needs. Before you act on any recommendation that may be contained in this report, independent advice ought to be sought from a financial adviser regarding the suitability of the investment product, taking into account your specific investment objectives, financial situation or particular needs.
StoneX Financial Pte. Ltd., may distribute reports produced by its respective foreign entities or affiliates within the StoneX group of companies or third parties pursuant to an arrangement under Regulation 32C of the Financial Advisers Regulations. Where the report is distributed to a person in Singapore who is not an accredited investor, expert investor or an institutional investor (as defined in the Securities Futures Act), StoneX Financial Pte. Ltd. accepts legal responsibility to such persons for the contents of the report only to the extent required by law. Singapore recipients should contact StoneX Financial Pte. Ltd. at 6826 9988 for matters arising from, or in connection with the report.
In the case of all other recipients of this report, to the extent permitted by applicable laws and regulations neither StoneX Financial Pte. Ltd. nor its associated companies will be responsible or liable for any loss or damage incurred arising out of, or in connection with, any use of the information contained in this report and all such liability is hereby expressly disclaimed. No representation or warranty is made, express or implied, that the content of this report is complete or accurate.
StoneX Financial Pte. Ltd. is not under any obligation to update this report.
Trading CFDs carries a high level of risk that may not be suitable for some investors. Consider your investment objectives, level of experience, financial resources, risk appetite and other relevant circumstances carefully. The possibility exists that you could lose some or all of your investments, including your initial deposits. If in doubt, please seek independent expert advice. Visit www.forex.com/en-sg/terms-and-policies for the complete Risk Disclosure Statement.