



The Pound takes it on the chin
Last weeks poor economic data caused the wheels to fall off the Pound.
Share this:

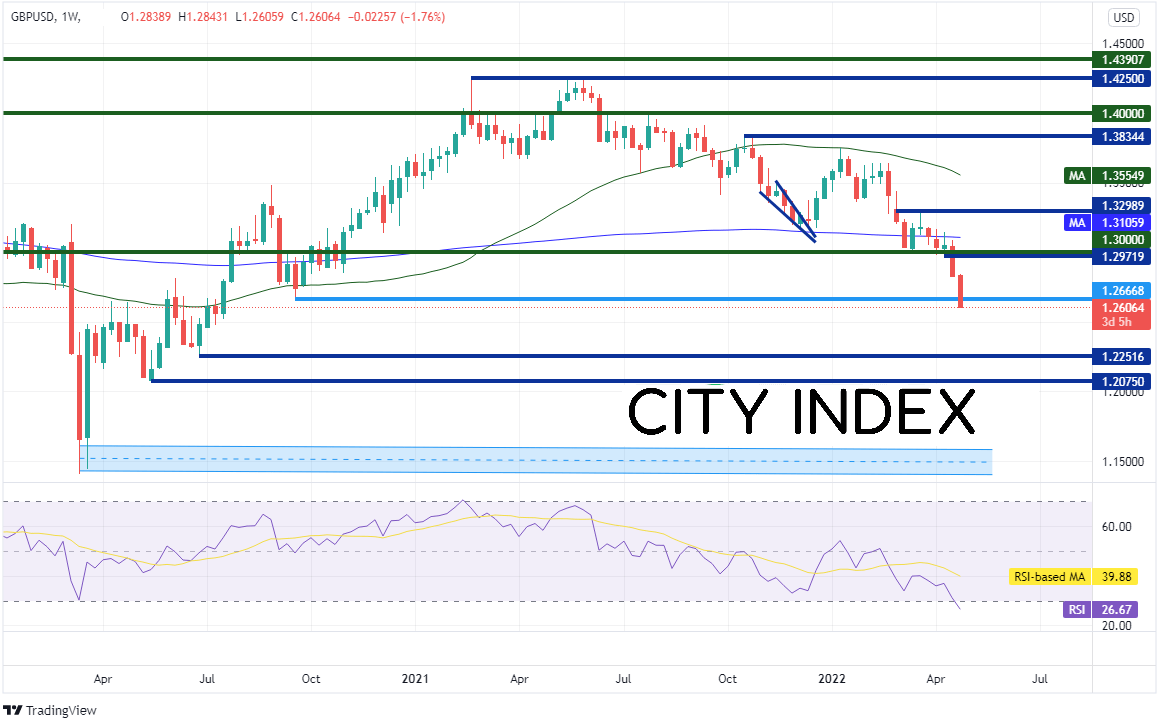
GBP/USD has been moving lower since June 2021 when the pair reached a high of near 1.4250! However, the selloff continued after the last BOE meeting when officials warned that inflation, particularly due to the Russia/Ukraine war, could squeeze household incomes. Therefore, future interest rate increases would depend on the medium-term lookout on inflation. Inflation rose from 6.2% in February to 7% in March. However, it wasn’t until late last week that that GBP/USD began to take a nosedive as both consumer confidence and retail sales were much weaker than expected. The combination of a squeeze in household income, weaker economic data, and a strong US Dollar, was enough to push GBP/USD below the psychological round number support of 1.3000 and the pair hasn’t looked back since. GBP/USD is currently trading at its lowest level since July 2020. However, unlike the DXY and EUR/USD which are approaching March 2020 levels, GBP/USD is not. The pair reached a low of 1.1445 at the height of the pandemic in March 2020. On the weekly timeframe, horizontal support isn’t until 1.2252 and then 1.2075. Below there and price can fall to the March 2020 lows. Notice that the RSI on the weekly timeframe is oversold, indicating the possibility for a bounce.

Source: Tradingview, Stone X
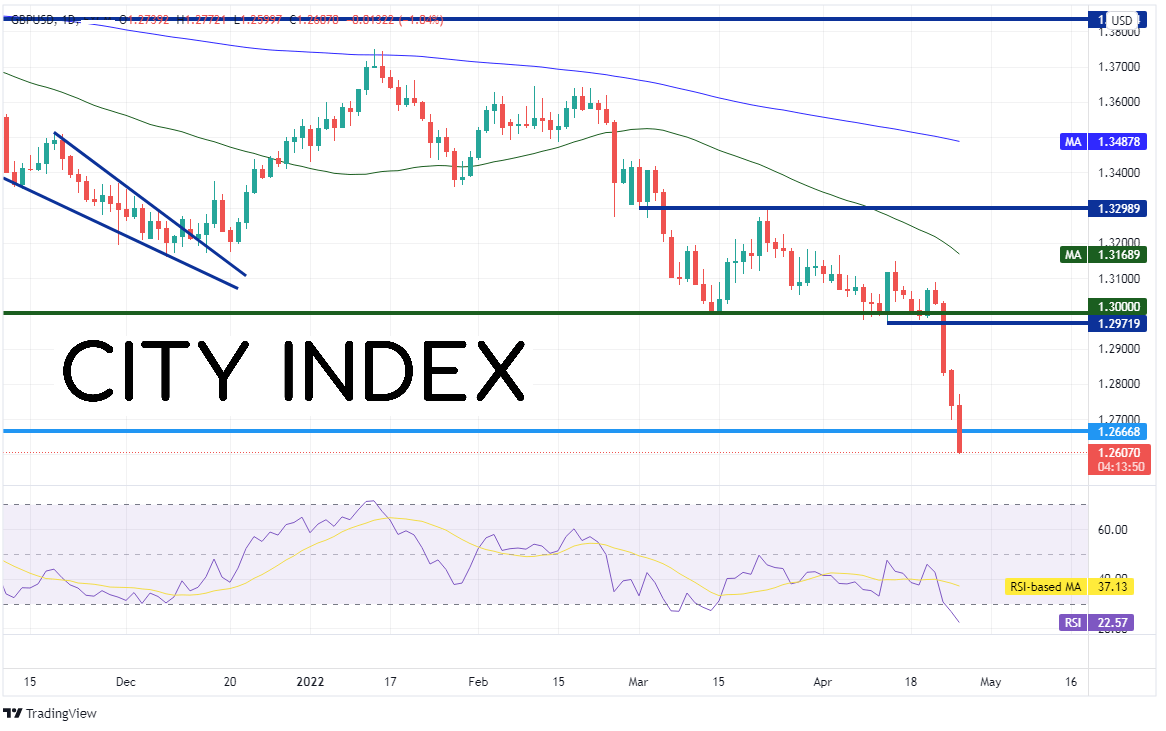
On a daily timeframe, over the last 4 sessions, traders have sold GBP/USD from 1.3090 down to today’s low, just below 1.2600. Notice that the RSI on the daily timeframe is also in oversold territory. If price does bounce, first resistance is at recent horizontal support (now resistance) at 1.2667. Above there, price can trade up to the lows of April 13th at 1.2971.

Source: Tradingview, Stone X
GBP/USD isn’t the only Pound pair that has been on the move lately. EUR/GBP has been moving in a downward sloping channel since April 2021. However, the pair has been pushing higher (GBP lower) since April 18th, including a bullish engulfing candle today. EUR/GBP also pushed above the 200 Day Moving Average at 0.8445. This now acts as the first level of support. Today’s low is the next level of support at 0.8393 and then the 50 Day Moving Average at 0.8352. If price continues to move higher, first resistance is at the top, downward sloping trendline of the channel near 0.8490, then the March 31st highs at 0.8512.

Source: Tradingview, Stone X
Fears that inflation would hit household income helped GBP/USD continue its path lower since mid-March. However, it wasn’t until last weeks poor economic data that caused the wheels to fall off the Pound. The BOE meets next week. Watch to see if traders take profits ahead of the meeting, which may give GBP a boost.
GBP/USD has been moving lower since June 2021 when the pair reached a high of near 1.4250! However, the selloff continued after the last BOE meeting when officials warned that inflation, particularly due to the Russia/Ukraine war, could squeeze household incomes. Therefore, future interest rate increases would depend on the medium-term lookout on inflation. Inflation rose from 6.2% in February to 7% in March. However, it wasn’t until late last week that that GBP/USD began to take a nosedive as both consumer confidence and retail sales were much weaker than expected. The combination of a squeeze in household income, weaker economic data, and a strong US Dollar, was enough to push GBP/USD below the psychological round number support of 1.3000 and the pair hasn’t looked back since. GBP/USD is currently trading at its lowest level since July 2020. However, unlike the DXY and EUR/USD which are approaching March 2020 levels, GBP/USD is not. The pair reached a low of 1.1445 at the height of the pandemic in March 2020. On the weekly timeframe, horizontal support isn’t until 1.2252 and then 1.2075. Below there and price can fall to the March 2020 lows. Notice that the RSI on the weekly timeframe is oversold, indicating the possibility for a bounce.
Source: Tradingview, Stone X
Trade GBP/USD now: Login or Open a new account!
• Open an account in the UK
• Open an account in Australia
• Open an account in Singapore
On a daily timeframe, over the last 4 sessions, traders have sold GBP/USD from 1.3090 down to today’s low, just below 1.2600. Notice that the RSI on the daily timeframe is also in oversold territory. If price does bounce, first resistance is at recent horizontal support (now resistance) at 1.2667. Above there, price can trade up to the lows of April 13th at 1.2971.
Source: Tradingview, Stone X
GBP/USD isn’t the only Pound pair that has been on the move lately. EUR/GBP has been moving in a downward sloping channel since April 2021. However, the pair has been pushing higher (GBP lower) since April 18th, including a bullish engulfing candle today. EUR/GBP also pushed above the 200 Day Moving Average at 0.8445. This now acts as the first level of support. Today’s low is the next level of support at 0.8393 and then the 50 Day Moving Average at 0.8352. If price continues to move higher, first resistance is at the top, downward sloping trendline of the channel near 0.8490, then the March 31st highs at 0.8512.

Source: Tradingview, Stone X
Trade EUR/GBP now: Login or Open a new account!
• Open an account in the UK
• Open an account in Australia
• Open an account in Singapore
Fears that inflation would hit household income helped GBP/USD continue its path lower since mid-March. However, it wasn’t until last weeks poor economic data that caused the wheels to fall off the Pound. The BOE meets next week. Watch to see if traders take profits ahead of the meeting, which may give GBP a boost.
Learn more about forex trading opportunities.
Related tags:


Open an account in minutes
Experience award-winning platforms with fast and secure execution, and enjoy tight spreads from 0.5 pts on FX and 0.3 pts on indices.
Economic calendar
Web Trader platform
Our sophisticated web-based platform is packed with features.
Related articles
USD/CAD shooting star puts September surge on notice
USD/CAD has printed a clear bearish reversal pattern after an extraordinary September surge, but confirmation may depend heavily on how US Treasury yields react to Friday’s payrolls report.

USD/CHF Reverses as Swiss Franc Surges amid Bond Carnage
USD/CHF reverses from channel resistance as bond volatility surges and broad Swiss franc strength points to a possible carry-trade unwind.


USD/MXN Analysis: Is Super Peso Starting to Fade?
Over recent trading sessions, the Mexican peso has continued to show signs of weakness against the U.S. dollar. This can already be seen in USD/MXN, which has gained more than 1.7% over the last three sessions, highlighting sustained buying pressure in favor of the dollar in the short term.

This report is intended for general circulation only. It should not be construed as a recommendation, or an offer (or solicitation of an offer) to buy or sell any financial products. The information provided does not take into account your specific investment objectives, financial situation or particular needs. Before you act on any recommendation that may be contained in this report, independent advice ought to be sought from a financial adviser regarding the suitability of the investment product, taking into account your specific investment objectives, financial situation or particular needs.
StoneX Financial Pte. Ltd., may distribute reports produced by its respective foreign entities or affiliates within the StoneX group of companies or third parties pursuant to an arrangement under Regulation 32C of the Financial Advisers Regulations. Where the report is distributed to a person in Singapore who is not an accredited investor, expert investor or an institutional investor (as defined in the Securities Futures Act), StoneX Financial Pte. Ltd. accepts legal responsibility to such persons for the contents of the report only to the extent required by law. Singapore recipients should contact StoneX Financial Pte. Ltd. at 6826 9988 for matters arising from, or in connection with the report.
In the case of all other recipients of this report, to the extent permitted by applicable laws and regulations neither StoneX Financial Pte. Ltd. nor its associated companies will be responsible or liable for any loss or damage incurred arising out of, or in connection with, any use of the information contained in this report and all such liability is hereby expressly disclaimed. No representation or warranty is made, express or implied, that the content of this report is complete or accurate.
StoneX Financial Pte. Ltd. is not under any obligation to update this report.
Trading CFDs carries a high level of risk that may not be suitable for some investors. Consider your investment objectives, level of experience, financial resources, risk appetite and other relevant circumstances carefully. The possibility exists that you could lose some or all of your investments, including your initial deposits. If in doubt, please seek independent expert advice. Visit www.forex.com/en-sg/terms-and-policies for the complete Risk Disclosure Statement.